Indicator & technique library · Trading techniques
Multi-Timeframe Analysis: Method, Settings and Uses
At a glance
- Multi-timeframe analysis means reading the same market on two or three chart intervals so that context, setup, and timing each come from the scale that shows them best.
- Its roots are Dow Theory's tides, waves, and ripples, later formalized in Alexander Elder's Triple Screen system with a roughly four-to-six ratio between timeframes.
- The mechanics are simple resampling: aggregate lower-timeframe bars into higher ones and only act on the last fully closed higher-timeframe bar to avoid lookahead bias.
- In the SOL/USDT daily test window, price spent 40% of days above its 50-period EMA and only 8 of 20 EMA crosses moved in the signal's direction after six bars — alignment is context, not an edge by itself.
Multi-timeframe analysis (often written as multiple timeframe analysis, or MTF) is the practice of studying one market on two or three chart intervals at once — for example a daily chart for direction, a 4-hour chart for the setup, and a 1-hour chart for entry timing. It is not an indicator you add to a chart; it is a procedure for deciding which chart gets to answer which question.
Traders care about it because almost every disagreement they have with their own charts is a timeframe problem. A 15-minute chart can look like a clean breakout while the daily chart shows price pressing into a four-month ceiling. MTF does not remove that conflict, but it makes the conflict visible before the order is placed instead of after.
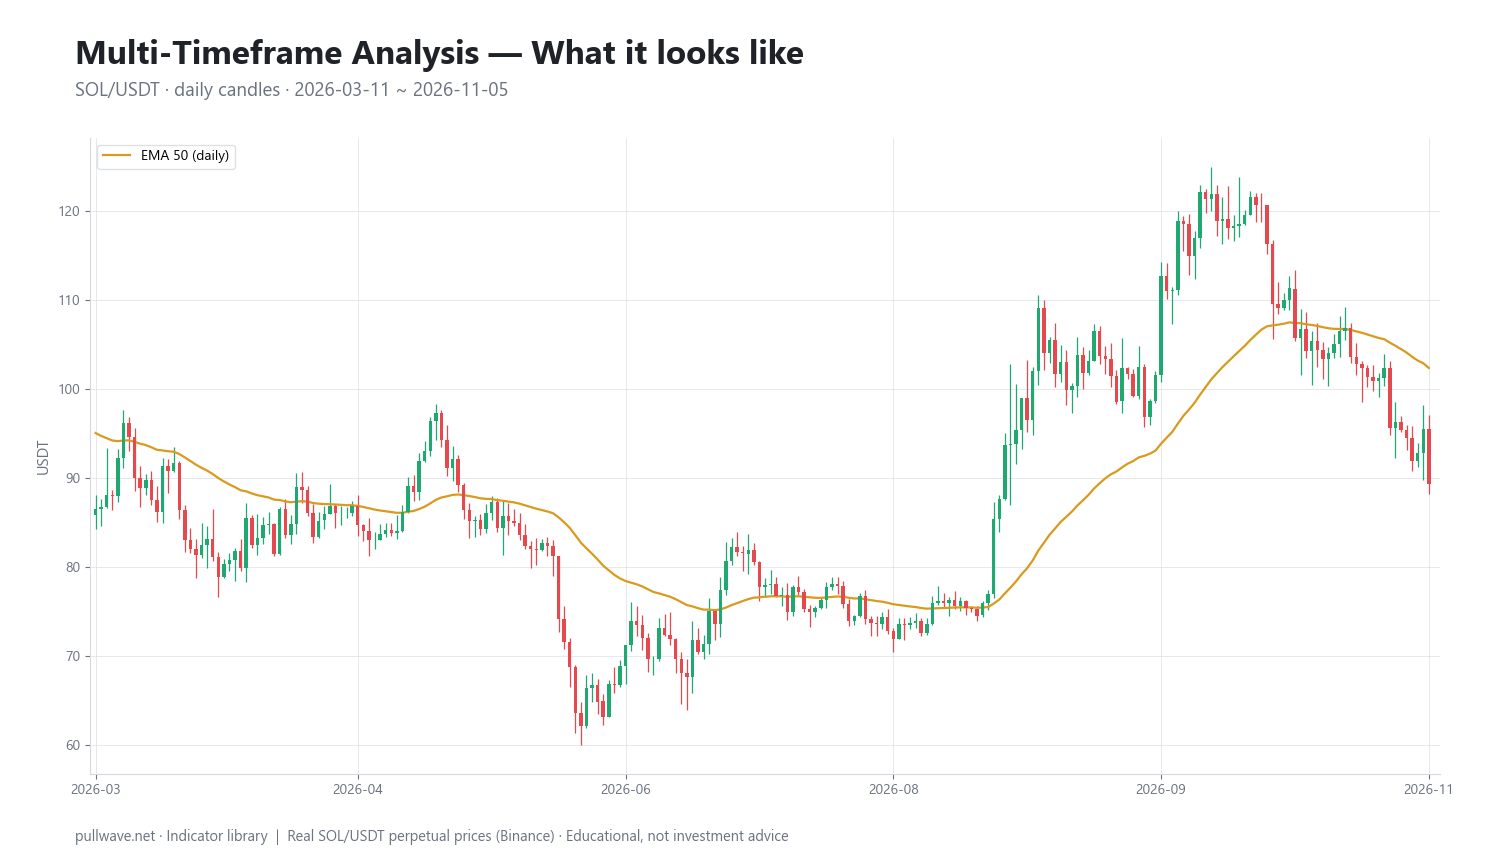
Figure 1 shows the reference market used throughout this page: SOL/USDT perpetual on Binance, daily candles from March 11, 2026 to November 5, 2026, with a 50-period EMA drawn on the daily close as the higher-timeframe filter. Everything a lower-timeframe trader would do inside that window is governed by whether price sits above or below that line.
What is Multi-Timeframe Analysis?
Multi-timeframe analysis is a top-down workflow in which the same price series is viewed at different levels of aggregation, and each level is assigned a specific job:
- Higher timeframe (context): what is the dominant direction, and where are the levels that matter to most participants?
- Trading timeframe (setup): is a recognizable pattern or pullback forming that fits that context?
- Lower timeframe (timing): where exactly does the position start, and where is it objectively wrong?
The higher chart never tells you where to enter, and the lower chart never tells you which way to lean. Mixing those roles is the single most common way MTF is misused.
Because the underlying data is identical — a 4-hour candle is just four 1-hour candles aggregated together — MTF adds no new information. What it adds is filtering. Aggregation suppresses short-term noise, so the higher timeframe shows the slower component of price. The cost of that filtering is lag, and that cost is real and permanent.
The idea behind it (theory and history)
The concept predates modern charting software. Charles Dow, writing editorials in The Wall Street Journal around 1900–1902, described market movement in three simultaneous degrees. Robert Rhea's 1932 book The Dow Theory, which systematized Dow's and William Hamilton's writings, popularized the metaphor of tides, waves, and ripples: a primary trend lasting months to years, a secondary reaction lasting weeks, and daily fluctuation inside both.
Ralph Nelson Elliott extended the idea in The Wave Principle (1938), arguing that wave structures nest inside one another at every degree of scale. Much later, the mathematician Benoit Mandelbrot made a related but statistical point: financial price series show broadly self-similar roughness across time scales, which is why an unlabeled chart of 5-minute bars and one of weekly bars are often hard to tell apart.
The modern trading version is Alexander Elder's Triple Screen Trading System, first published in Futures magazine in the mid-1980s and described in detail in Trading for a Living (1993). Elder's rules are explicit: choose a favorite timeframe, multiply it by about five to get the higher one, divide by about five to get the lower one; take the trend from the higher chart, take the oscillator signal from the middle chart only when it points the same way, and use the lower chart for entry.
The logical case for MTF is simple. Any single chart is an arbitrary sampling rate. A signal that looks decisive on one sampling rate may be a small wiggle on another. Checking a second scale is a cheap robustness test — not a guarantee of a better outcome.
How it is calculated
There is no MTF formula, but there is an exact aggregation rule and an exact alignment rule, and both matter.
Step 1 — Resample. A higher-timeframe bar is built from the lower-timeframe bars inside its period: the open of the first bar, the highest high, the lowest low, the close of the last bar, and the summed volume.
Step 2 — Use only closed bars. The current higher-timeframe candle is unfinished. Its close, and therefore any indicator value derived from it, keeps changing until the period ends. Decisions must reference the last completed higher-timeframe bar, or your backtest will contain information you could not have had.
Step 3 — Compute the filter on the higher timeframe. In the example used here the filter is a 50-period EMA of the daily close.
Step 4 — Project the state down. Each lower-timeframe bar inherits the state of the most recent closed higher-timeframe bar. That state is a permission, not a trigger.
``` Resample (lower TF -> higher TF, per period P): Open_H = Open of first bar in P High_H = max(High) over P Low_H = min(Low) over P Close_H = Close of last bar in P Vol_H = sum(Volume) over P
Higher-TF filter (example: daily EMA 50): k = 2 / (50 + 1) EMA50(t) = Close_d(t)k + EMA50(t-1)(1-k)
Bias(t) = +1 if Close_d(last closed day) > EMA50(last closed day) = -1 if Close_d(last closed day) < EMA50(last closed day)
Act on lower TF only if sign(setup) == Bias(t) ```
Default settings and variations
The only genuine "setting" in MTF is the ratio between timeframes. Elder's factor of five is the classic; most practitioners use something between four and six. Below four, the two charts repeat each other (a 15-minute and a 30-minute chart rarely disagree). Above about eight, the higher chart updates so rarely that it stops describing current conditions.
| Style | Context | Setup | Timing | Typical hold |
|---|---|---|---|---|
| Scalping | 4h | 30m | 5m | minutes–hours |
| Intraday | 1d | 4h | 15m–1h | hours–days |
| Swing | 1w | 1d | 4h | days–weeks |
| Position | 1M | 1w | 1d | weeks–months |
Common variations in what the higher timeframe actually provides:
- Trend filter: a moving average (EMA 50 or EMA/SMA 200), slope of that average, or simple structure (higher highs and higher lows).
- Level map: prior week high/low, prior day high/low, higher-timeframe swing points and ranges, drawn onto the execution chart.
- Momentum state: an oscillator such as RSI or MACD read on the higher chart only, to grade whether the trend is extended or resetting.
- Volatility reference: higher-timeframe ATR used to size stops so they are not placed inside normal noise.
Crypto adds a few alignment details. Daily candles on most venues close at 00:00 UTC, but not all platforms label them identically, so a "daily" EMA can differ between two charts of the same asset. Weekly candles usually open Monday 00:00 UTC. Perpetual funding typically settles every eight hours, which makes 4h and 8h charts natural intermediate scales for futures traders. And because the market never closes, there is no gap or session open to anchor the day — the higher timeframe is doing more work than it does in equities.
How to read it
Work from the top down, in this order, and write the answer down before moving to the next chart:
- Context chart. Up, down, or sideways? Where is the nearest higher-timeframe level above and below current price? If the answer is "sideways inside a wide range," that is a valid answer and it changes everything below.
- Setup chart. Is price pulling back into the direction of the context, building a base, or breaking a structure? A setup that requires the context chart to be wrong is a low-conviction setup.
- Timing chart. Where does the entry sit relative to the invalidation level, and is the resulting risk acceptable at your position size?
The useful states are: aligned (all three agree, usually the fewest opportunities but the cleanest), conflicted (lower timeframe runs against the higher — often a pullback, sometimes an early reversal, never obvious in real time), and neutral (the higher timeframe is ranging, in which case range tactics beat trend tactics regardless of what the 5-minute chart is doing).
How traders use it
1. As a directional filter. Only consider long setups while the daily close is above its EMA 50, only shorts while below. Works when the higher timeframe is genuinely trending, because it removes the counter-trend trades that bleed accounts. Fails in chop, where price oscillates around the filter and flips the permission every few days — exactly what the SOL window below shows in July.
2. As a level map. Draw higher-timeframe swing highs, lows, and range edges on the execution chart and treat them as zones where behavior changes. Works in both trends and ranges, since levels do not require a direction to be useful. Fails when a level has already been tested many times, or during vertical liquidation-driven moves in crypto futures, when price passes through levels with no reaction at all.
3. For pullback entries. Higher timeframe trending, lower timeframe oversold or breaking a small counter-trend structure. This is the core of Elder's Triple Screen. Works in orderly trends with regular retracements. Fails in two ways: strong trends that never pull back leave you watching, and trends that are quietly ending offer a pullback that keeps going.
4. For risk and trade management. Size and place stops using higher-timeframe volatility and invalidation, then manage the position on the lower chart. Works because it stops you from using a 5-minute stop on a daily idea. Fails when traders keep the wide higher-timeframe stop but also keep the leverage they had chosen for a tight stop — in perpetual futures that combination is how a correct directional read still ends in liquidation.
Example on a real SOL chart
The test is deliberately plain: SOL/USDT perpetual on Binance, daily candles from March 11, 2026 to November 5, 2026, last close 89.30, with the daily EMA 50 as the higher-timeframe filter. Over this window price closed above the EMA on 40.0% of days, so the "bullish permission" state was the minority state. There were 20 crosses of the filter in total.
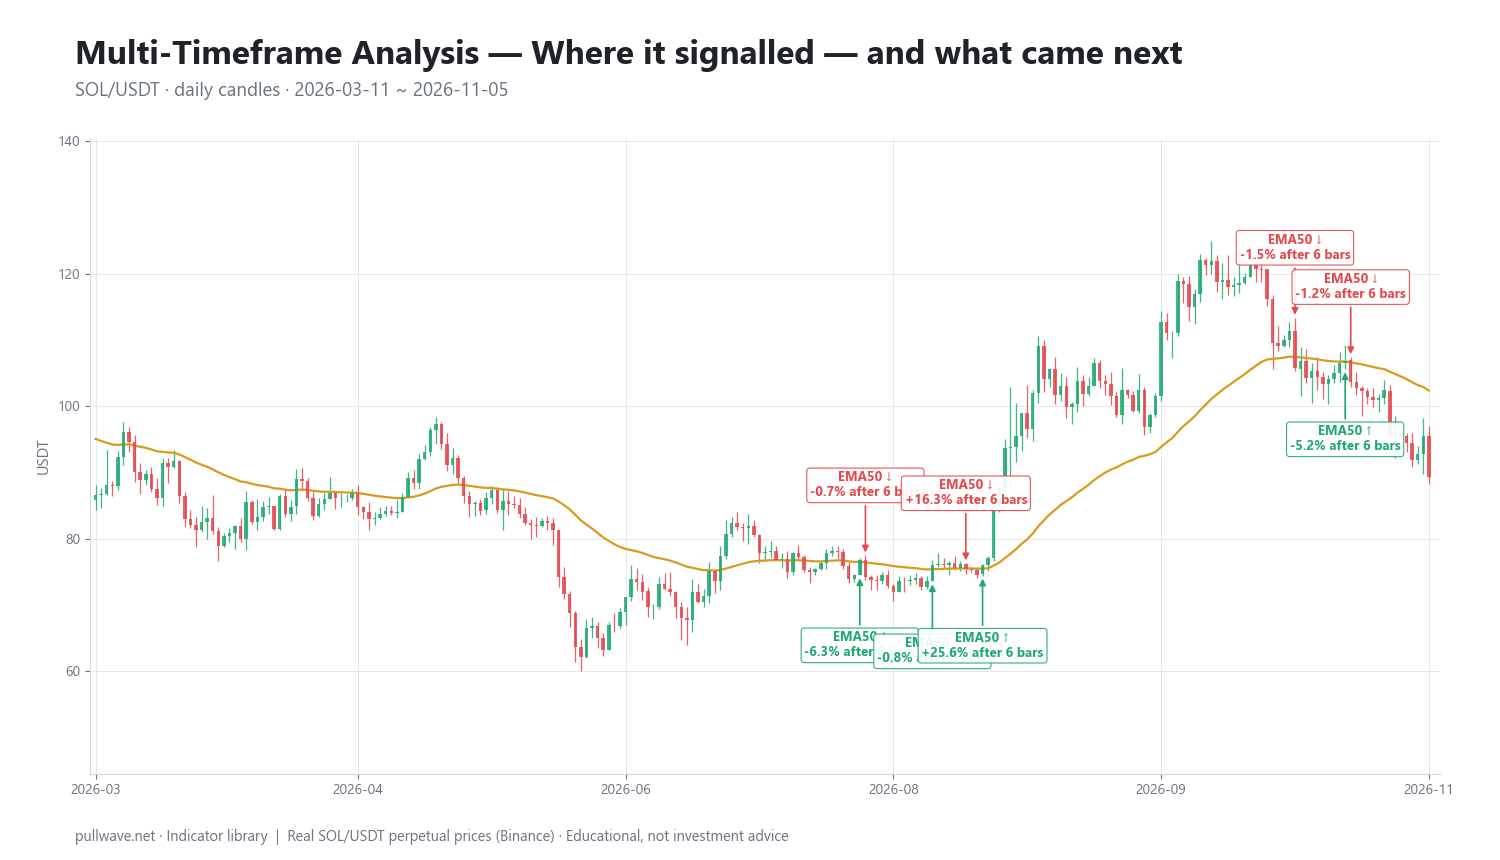
Figure 2 marks each cross and the percentage move that followed after 6 and 18 daily bars. Ten of the twenty events:
| Date | Signal | Price | After 6 bars | After 18 bars |
|---|---|---|---|---|
| 2026-07-20 | EMA50 ↑ | 77.80 | −1.36% | −5.37% |
| 2026-07-23 | EMA50 ↓ | 75.83 | −2.87% | +0.16% |
| 2026-07-26 | EMA50 ↑ | 76.74 | −6.29% | −0.66% |
| 2026-07-27 | EMA50 ↓ | 74.16 | −0.74% | +1.63% |
| 2026-08-08 | EMA50 ↑ | 76.00 | −0.83% | +34.28% |
| 2026-08-14 | EMA50 ↓ | 75.37 | +16.27% | +32.59% |
| 2026-08-17 | EMA50 ↑ | 75.99 | +25.60% | +34.04% |
| 2026-10-12 | EMA50 ↓ | 105.70 | −1.54% | −8.89% |
| 2026-10-21 | EMA50 ↑ | 106.90 | −5.25% | −16.46% |
| 2026-10-22 | EMA50 ↓ | 103.62 | −1.20% | −13.82% |
Three things stand out. First, the July cluster: four crosses between July 20 and July 27, none of which led anywhere — classic whipsaw while price sat on top of the average. Second, August: the August 8 up-cross at 76.00 looked wrong after six days (−0.83%) and right after eighteen (+34.28%), while the August 14 down-cross at 75.37 was immediately contradicted (+16.27% after six bars). The August 17 up-cross at 75.99 caught the move cleanly, +25.60% and +34.04%. Third, October ran the other way: the down-crosses at 105.70 and 103.62 preceded declines of −8.89% and −13.82% over eighteen bars, while the up-cross at 106.90 lost −16.46%.
Across all twenty events, 8 of 20 moved in the signal's direction over the shorter horizon. That is under half. The honest reading is that a higher-timeframe moving-average state is a context switch, not an entry signal — its value is in telling a lower-timeframe trader which side of the book to favor during the sustained stretches (August onward), while the price paid is the cluster of flips in a sideways regime. This is one asset, one filter, one eight-month window, and it proves nothing about other markets or periods.
Common mistakes
- Reading an unfinished higher-timeframe bar. The daily candle you are looking at mid-session is not a daily candle yet. Decisions based on it cannot be reproduced in a backtest.
- Choosing timeframes that are too close. A 1h/2h pair is one chart with extra steps. Keep the ratio near four to six.
- Using four or five charts. Beyond three, the probability that all agree collapses and you either never trade or start ignoring the ones that disagree.
- Timeframe shopping. Scrolling through intervals until one supports a position you already want is confirmation bias with extra screens.
- Importing the higher-timeframe stop and the lower-timeframe leverage. The two must be chosen together; in perpetuals this mismatch is the difference between a normal retrace and a liquidation.
- Expecting alignment to raise the win rate automatically. Alignment is a selection rule. It reduces the number of trades and the number of counter-trend losses, and it adds lag and missed entries in exchange.
Combining it with other tools
MTF is a container, so almost anything can sit inside it. A few pairings that are logically consistent:
- Moving averages supply the simplest context state (price versus EMA 50 or EMA 200, or the slope of the average).
- RSI or MACD are more informative on the context chart than on the execution chart, where their signals are frequent and noisy; the Triple Screen uses exactly this split.
- ATR from the higher timeframe sets stop distance and position size, so risk is scaled to the move you are actually trading.
- Market structure and volume profile give the level map; higher-timeframe value areas and swing points become the lower-timeframe decision zones.
- Open interest and funding add a crypto-specific layer: a higher-timeframe trend running alongside persistently extreme funding often means the move is crowded, which affects how much room a pullback needs.
The discipline is to assign each tool to exactly one timeframe and leave it there. The same oscillator read on three charts produces three opinions and no decision.
Frequently asked questions
Q. What is the best timeframe combination for crypto trading?
There is no universally best set, but the common ones keep a ratio of roughly four to six between charts: 1w/1d/4h for swing trading, 1d/4h/1h for multi-day positions, and 4h/30m/5m for intraday work. Pick the middle chart first — it should match how long you can realistically hold a position — then derive the other two. Because crypto trades 24/7, daily and weekly boundaries follow UTC rather than any exchange session.
Q. How many timeframes should I use?
Two or three. Two (context plus execution) is enough for most traders and is easier to keep consistent; three adds a setup chart between them, which is the structure of Elder's Triple Screen. Four or more charts rarely improve decisions and usually produce either paralysis or selective attention to whichever chart agrees with you.
Q. Does multi-timeframe analysis repaint?
The data does not repaint, but an in-progress higher-timeframe bar changes until it closes, so any value derived from it is provisional. If a strategy or script reads the current, unfinished higher-timeframe candle in a backtest, it has lookahead bias and will look far better than it could have been live. Always reference the last fully closed higher-timeframe bar.
Q. Should the higher timeframe always override the lower one?
Not always — it overrides for direction, not for timing or risk. The higher timeframe lags by construction, so at genuine turning points it will be wrong while the lower chart is already right. That is why the higher chart is best used to decide which trades you will consider, with the lower chart deciding where the idea is invalidated.
Q. Which timeframe should I place my stop on?
On the chart that defines the idea, which is usually the setup timeframe, not the execution one. If the trade thesis is a daily pullback, a stop that sits inside normal 5-minute noise will be removed by randomness before the thesis is tested. Set the stop at the level that falsifies the idea, then size the position so that distance is affordable.
Q. Does multi-timeframe analysis work in a 24/7 market?
The method transfers fine, since it depends only on aggregation, not on trading sessions. What changes is that crypto has no daily open gap to anchor the higher timeframe, volatility clusters around funding settlements and liquidation cascades, and the same asset may show slightly different daily candles across venues. Fix your timezone convention and your venue, and keep both constant.
Key takeaways
- Multi-timeframe analysis assigns one job to each chart: context from the higher timeframe, setup from the middle, timing and invalidation from the lower.
- The intellectual lineage runs from Dow Theory's tides, waves, and ripples through Elliott's nested waves to Elder's Triple Screen, which fixed the practical ratio at about five between timeframes.
- Mechanically it is only resampling plus one hard rule: act on the last closed higher-timeframe bar, never the one still forming.
- In the SOL/USDT daily window from March to November 2026, price was above its EMA 50 on just 40% of days and only 8 of 20 crosses moved in the signal's direction after six bars — alignment filters trades, it does not create an edge.
- The biggest practical risk is mismatched risk: a higher-timeframe thesis with lower-timeframe leverage, which in perpetual futures can end a correct trade before it resolves.
Educational material. Charts use real SOL/USDT perpetual prices; past behaviour does not predict future results. Not investment advice.