Indicator & technique library · Indicator library
Pivot Points Explained: Formula, Settings and Uses
At a glance
- Pivot points are a set of support and resistance levels calculated mechanically from the previous session's high, low and close.
- The classic formula is P = (H + L + C) / 3, with R1/S1 and R2/S2 projected from the prior range.
- They are reference levels, not signals: price reacting at a level matters more than the level itself.
- In 24/7 crypto markets the session boundary is a choice — most traders use the UTC day, weekly or monthly pivots.
Pivot points are a grid of horizontal price levels — a central pivot plus several supports and resistances — derived from the previous session's high, low and close. Nothing is fitted or optimized: everyone using the same session and the same formula gets the same numbers, which is precisely the point.
Traders care about them because they are objective, known before the session starts, and widely watched. A level that thousands of participants have drawn on the same chart becomes a natural place for resting orders, for scaling in and out, and for defining where an idea is wrong. In crypto, where 24/7 trading blurs the concept of a "session," pivots also impose a useful daily structure on an otherwise continuous tape.
What are pivot points?
A pivot point set is produced by one arithmetic recipe applied to three inputs: the high, low and close of the prior period. The output is typically seven lines — the central pivot P, resistances R1, R2, R3 above it, and supports S1, S2, S3 below it.
The central pivot is simply the average of high, low and close: a crude but robust estimate of where value was concentrated. Everything else is a projection of the prior period's range, mirrored above and below that center.
Unlike a moving average or RSI, pivots do not recalculate bar by bar. They are fixed for the whole session and then jump to new values when the next session begins. That makes them a static framework — closer to drawing support and resistance by hand, except the hand is replaced by a rule.
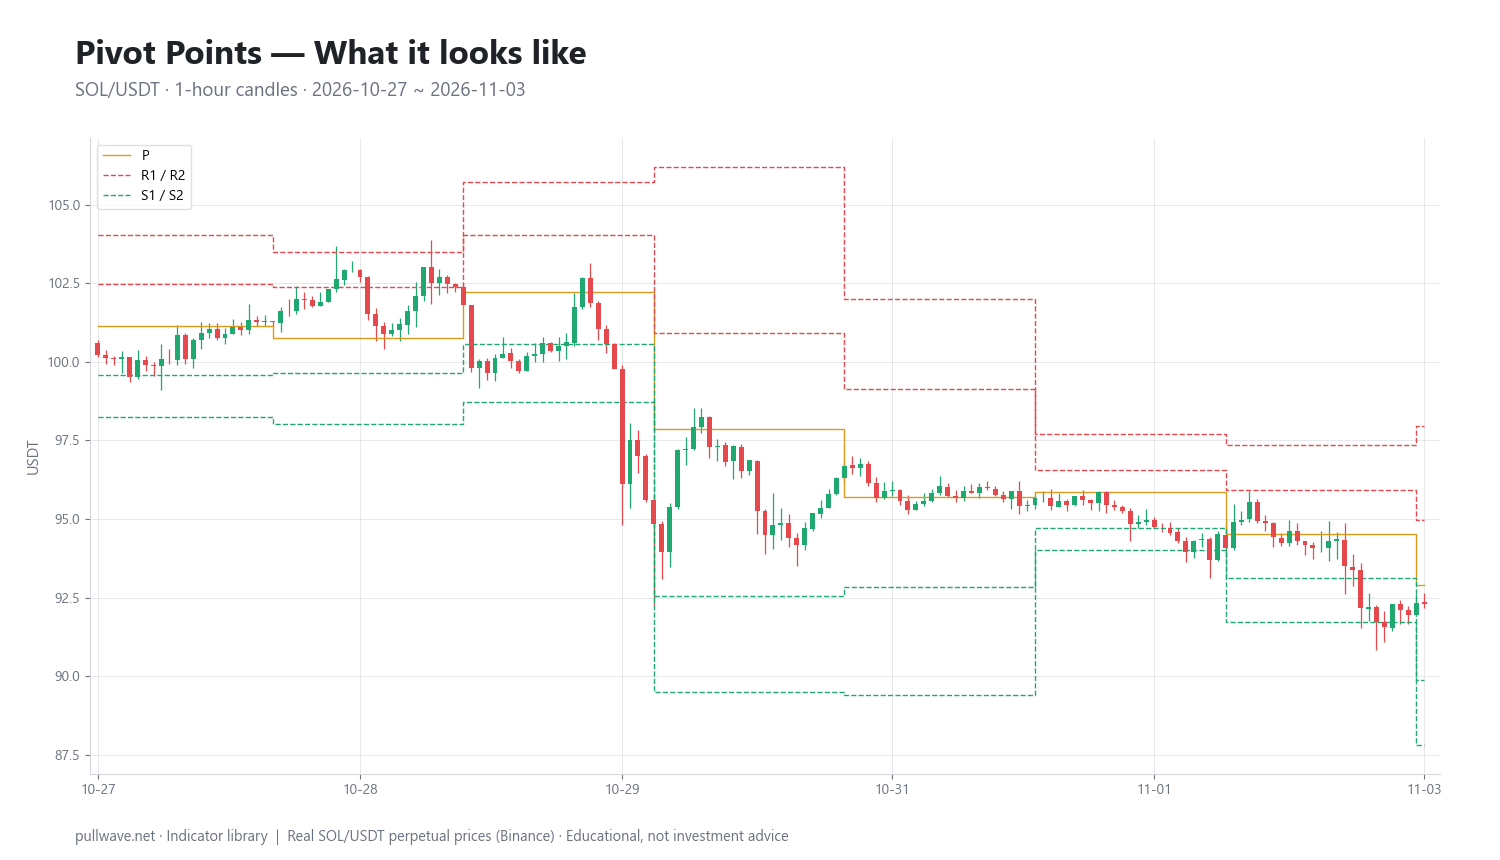
Figure 1 shows classic daily pivots on SOL/USDT 1-hour candles: the dashed central pivot P in the middle, R1 and R2 stacked above, S1 and S2 below, with each level stepping to a new value at the start of each UTC day.
The idea behind it (theory and history)
Pivot points come from the open-outcry futures pits, which is why they are still called "floor pivots." A pit trader could not run software; they needed numbers they could compute by hand before the bell and carry on a card. The three-input average did the job.
The original author is not reliably documented — the technique circulated as pit folklore long before it appeared in books, so you should be skeptical of any confident attribution. What is well documented is the modern popularization: John L. Person wrote about pivot analysis extensively in the 2000s, including A Complete Guide to Technical Trading Tactics (2004), and Mark B. Fisher's The Logical Trader (2002) built a widely followed methodology around opening ranges and pivot reference levels. The Camarilla equations are commonly credited to a bond trader named Nick Scott around 1989, but that story is anecdotal and should be treated as such.
The theory is straightforward. Markets spend most of their time rotating around a perceived fair value and spend a minority of their time trending away from it. The prior session's average price is a reasonable proxy for that value, and the prior session's range is a reasonable proxy for how far the market is currently willing to travel from it. Project that range above and below the average and you get plausible turning zones — not because the numbers are magic, but because range is persistent from one session to the next and because many participants watch the same arithmetic.
How it is calculated
Take the high (H), low (L) and close (C) of the previous completed session. Then:
- Central pivot: average H, L and C. This is P.
- First resistance: double P and subtract the prior low. R1 sits above P by the distance from the prior low up to P.
- First support: double P and subtract the prior high. S1 sits below P by the distance from P up to the prior high.
- Second levels: add the full prior range (H − L) to P for R2, subtract it for S2.
- Third levels: add one full prior range to R1, and subtract one full prior range from S1. That is, R3 = R1 + (H − L) = H + 2 × (P − L), and S3 = S1 − (H − L) = L − 2 × (H − P).
P  = (H + L + C) / 3
R1 = (2 * P) - L
S1 = (2 * P) - H
R2 = P + (H - L)
S2 = P - (H - L)
R3 = H + 2 * (P - L)     # = R1 + (H - L)
S3 = L - 2 * (H - P)     # = S1 - (H - L)
A frequent misstatement is that the third levels sit one range width beyond the prior high and low. They do not, in general. The distance from H up to R3 equals 2 × (P − L), which only happens to equal the full range when the close sits exactly at the midpoint of the prior range. The clean way to remember it is relative to the first levels: R3 is one range above R1, S3 is one range below S1.
Two further consequences are worth noticing. First, R1 and S1 are not symmetric around P unless the close sits exactly in the middle of the range. Because P − S1 equals H − P and R1 − P equals P − L, a close near the prior high lifts the whole grid and places R1 farther above P, while S1 sits closer beneath it; a close near the prior low does the reverse. Second, the width of the entire structure is proportional to yesterday's range, so pivots automatically widen in volatile conditions and compress in quiet ones. That is a built-in volatility adjustment most traders never think about.
Default settings and variations
The two settings that matter are the formula and the session length. Everything else is cosmetic.
| Variant | Central pivot | Character |
|---|---|---|
| Classic / floor | (H + L + C) / 3 | Widest adoption, levels spaced by the prior range |
| Woodie | (H + L + 2C) / 4 | Double-weights the close, so levels hug the most recent price |
| Camarilla | Close-based, range × 1.1/12, /6, /4, /2 | Very tight inner levels, built for mean reversion |
| Fibonacci | Classic P, levels at 0.382, 0.618, 1.000 × range | Narrower R1/S1 than classic, familiar ratios |
| DeMark | Depends on close vs. open | Produces only one support and one resistance |
Session length is the real decision. On traditional markets the "day" is defined by the exchange calendar. Crypto has no close, so the convention is the UTC day, which is what most charting platforms use by default. Weekly pivots (from the prior Monday–Sunday) and monthly pivots are also popular and tend to be more meaningful because they summarize more data and are watched by more participants.
Match the pivot period to your holding period. Daily pivots on a 1–15 minute chart, weekly pivots on 1–4 hour charts, monthly pivots on the daily chart. Daily pivots on a weekly chart are noise; monthly pivots on a 1-minute chart are a wall you will never reach.
How to read it
Start with the central pivot as a bias line. Price trading persistently above P means buyers have been paying more than yesterday's average value; persistently below means the opposite. Many discretionary traders use nothing but this: above P they look for long setups, below P for short setups.
Then read the outer levels as zones where the prior session's range is exhausted. Reaching R1 means the market has already traveled the distance from yesterday's low to yesterday's average, measured upward from that average. Reaching R2 means it has covered a full prior range beyond the pivot. The further out you go, the rarer the touch and the more it signals that something unusual is happening.
The critical reading skill is distinguishing reaction from acceptance. A long wick and an immediate rejection at R1 is a reaction — the level held. Twenty candles grinding sideways just above R1 is acceptance — the level has been absorbed and now acts as potential support. The levels do not predict; the behavior at them is the information.
A few structural observations help:
- The gap between yesterday's close and today's P hints at bias: opening far above P often reflects overnight momentum.
- A narrow prior range produces a tight pivot grid, which price can slice through in minutes. A wide prior range produces levels that may never be touched.
- Confluence matters: a pivot level that coincides with a prior swing high, a round number, or a moving average is a stronger reference than one sitting in empty space.
How traders use it
1. Mean reversion at the outer levels. Fade moves into R2/S2 or the Camarilla third and fourth levels, expecting a rotation back toward P. Works in balanced, range-bound regimes — choppy weekends, low-volatility consolidation, post-news digestion. Fails badly in trends: on a strong directional day, price blows through R1, R2 and R3 in sequence and the fader is on the wrong side of every one of them. This is the single most common way traders lose money with pivots.
2. Breakout and continuation from P. Treat a decisive move through the central pivot as a shift in session bias and look for continuation toward R1 or S1. Works when the prior session was narrow and the market is expanding out of compression. Fails when price oscillates across P repeatedly — in a range, P sits in the middle of the rotation and generates whipsaw after whipsaw.
3. Profit targets and trade management. Even traders who enter on something else use pivots to place exits: a long taken near S1 with P as the first objective, or a trend position scaled out at R1 and R2. This is arguably the most robust application, because it does not require the level to hold — only to be a place where other people take action.
4. Structural context and risk placement. Use the grid to decide where an idea is invalidated. If your thesis depends on the market holding above the central pivot, acceptance below it is objective evidence against you. Works in all regimes as a discipline tool. Fails when the levels are so tight that stops sit inside normal noise — a real risk in crypto on low-volatility days.
Example on a real SOL chart
The window below is SOL/USDT perpetual on Binance, 1-hour candles, 2026-10-27 to 2026-11-03, using classic floor pivots computed from the previous UTC day. The last close in the window was 92.30.
First, the distribution of touches. Counting bars whose range contained each level:
- P: 46 bars
- S1: 24 bars
- S2: 11 bars
- R1: 9 bars
- R2: 2 bars
The central pivot was by far the most visited line, which is the expected shape — it sits closest to the prior session's average price. The asymmetry is also informative: supports were touched roughly three times as often as resistances over this particular week, consistent with a market drifting down and closing the window at 92.30, well below where it had traded earlier.
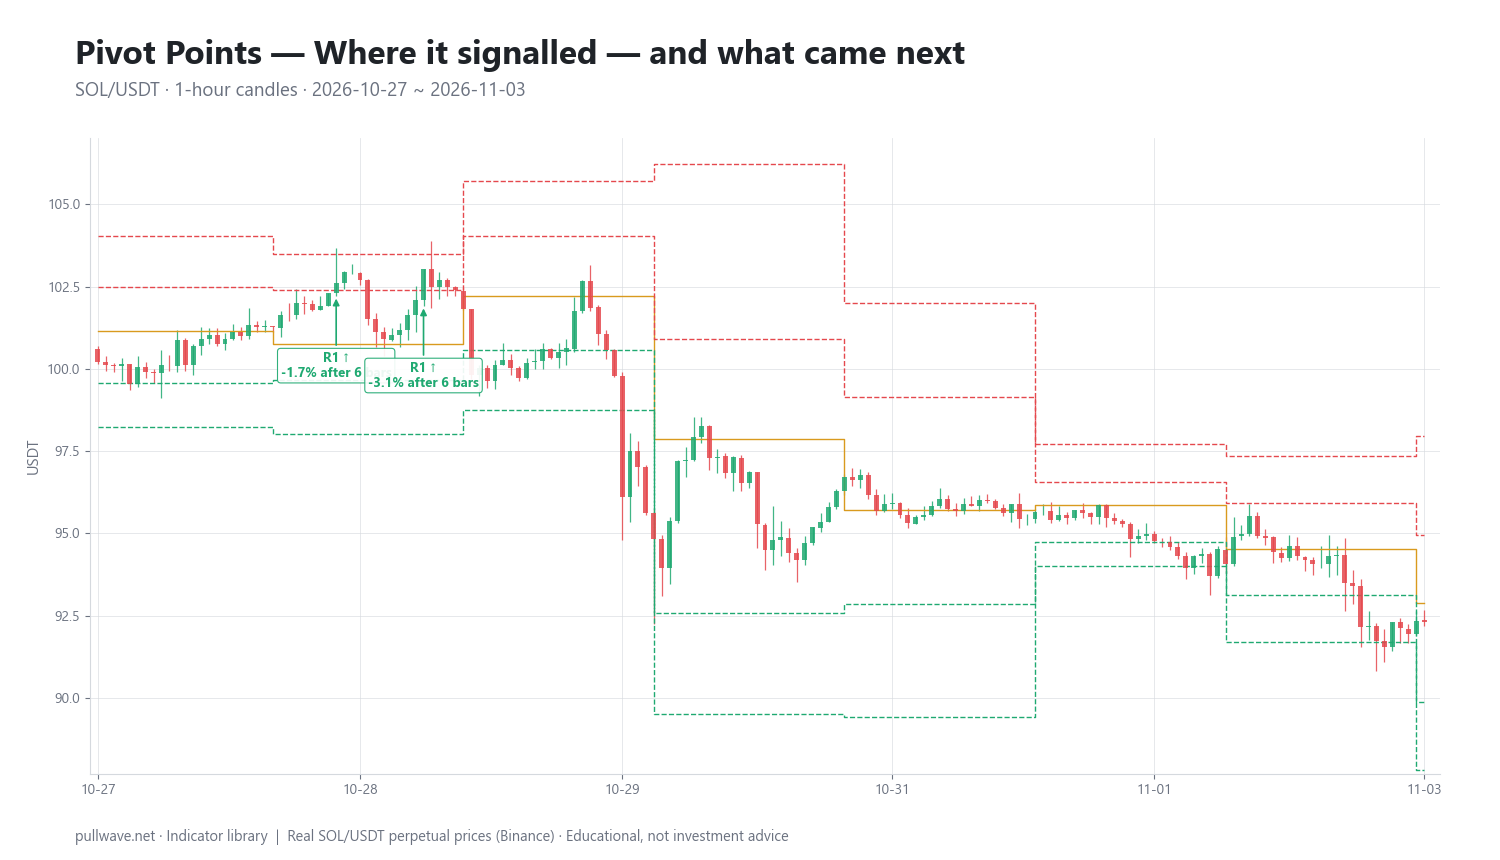
Figure 2 marks the two signal events in the window and the percentage change 6 and 18 hours later. Defining an "event" narrowly as an hourly close crossing above R1, there were only two in seven days:
| Time (UTC) | Event | Price | After 6 bars | After 18 bars |
|---|---|---|---|---|
| 2026-10-28 08:00 | R1 ↑ | 102.62 | −1.69% | −2.52% |
| 2026-10-28 19:00 | R1 ↑ | 103.02 | −3.13% | −2.33% |
Both crossings failed to extend. Treated as momentum signals, 0 of 2 moved in the signal direction after either horizon. Treated as mean-reversion opportunities — price pushing above the prior range projection and then rotating back — both would have resolved in the fader's favor, with declines of roughly 2–3% within a day.
Two honest caveats. Two events is not a sample; it is an anecdote, and no conclusion about pivot breakouts survives a sample size of two. And this is one market, one week, one timeframe, during a stretch where SOL was clearly under pressure. A trending week would have produced the opposite picture, with R1 acceptance leading on toward R2 and R3. The value of the example is in showing the mechanics — how often each level gets touched, how to define an event, how to measure what happened next — not in proving that anything works.
Common mistakes
- Treating a level as a signal. A pivot line is a location, not an instruction. Without confirmation from price behavior, a touch means nothing.
- Fading every extension in a trending market. The regime decides whether reversion or continuation is the higher-probability path. Shorting R2 on a strong expansion day is how accounts get hurt, particularly with leverage.
- Misremembering the third levels. R3 is one range width above R1, not one range width above the prior high. Traders who mis-derive it place targets and stops in the wrong place.
- Mismatched periods. Using daily pivots to manage a multi-week swing position, or monthly pivots to scalp, guarantees the levels are irrelevant to your horizon.
- Inconsistent session boundaries. If your chart uses UTC pivots and you mentally reference a different daily close, your levels differ from everyone else's — and the crowd-coordination effect, which is half the reason pivots function at all, disappears.
- Stacking too many variants. Classic, Woodie, Camarilla and Fibonacci pivots on one chart produce twenty lines; with that many levels, price is always "at a level" and the framework is useless.
- Ignoring liquidation mechanics on perps. Clustered stops just beyond an obvious level, combined with leverage, make brief overshoots common. Placing a stop exactly at R1 or S1 invites a wick through it.
Combining it with other tools
Pivots give you where; other tools give you whether. The natural pairings:
- A trend filter. A long-period moving average or ADX tells you which regime you are in, and therefore whether to fade the outer levels or trade continuation through them. This is the single highest-value addition.
- Volume or volume profile. A pivot that coincides with a high-volume node from the prior session is a far stronger reference than one in a thin area. Low volume on a break of P argues for a false move.
- Candlestick behavior. Rejection wicks, engulfing bars and failed breakouts at a level convert a passive line into an observable event with a definable invalidation point.
- Oscillators for divergence. RSI or MACD divergence occurring exactly at R2 or S2 is a classic confluence setup, because the price extension and the momentum reading disagree at a pre-marked location.
- Higher-timeframe pivots. Daily pivots that line up with the weekly or monthly pivot are the levels worth respecting most.
What pivots do not need is another support/resistance tool layered on top. Fibonacci retracements, round numbers, prior swings and pivots all answer the same question; adding them together mostly adds clutter.
Frequently asked questions
Q. What are pivot points in crypto trading?
Pivot points are support and resistance levels calculated from the previous session's high, low and close using a fixed formula. In crypto, where there is no daily close, the session is usually defined as the UTC day, so a new set of levels appears at 00:00 UTC. They are used as reference prices for entries, exits and bias rather than as standalone buy or sell signals.
Q. What is the pivot point formula?
The classic floor formula is P = (High + Low + Close) / 3, using the prior session's values. The first levels are R1 = 2P − Low and S1 = 2P − High, and the second levels are R2 = P + (High − Low) and S2 = P − (High − Low). The third levels sit one full range width beyond the first: R3 = High + 2 × (P − Low), which equals R1 + (High − Low), and S3 = Low − 2 × (High − P), which equals S1 − (High − Low).
Q. Which pivot point variant is best for crypto?
There is no objectively best variant. Classic floor pivots have the widest adoption, which matters because part of their effect comes from many traders watching identical numbers. Camarilla levels are tighter and suit mean-reversion styles, while Woodie weights the close more heavily; the sensible approach is to pick one, stay consistent, and judge it on your own markets and timeframes.
Q. Should crypto pivots reset at 00:00 UTC?
UTC midnight is the most common convention and the default on most platforms, so it is the boundary the largest number of traders share. Some traders prefer boundaries aligned with the US or Asian cash sessions because that is when volume concentrates. The key is consistency — switching boundaries changes every level and destroys comparability between your own observations.
Q. Are pivot points leading or lagging indicators?
They are leading in the sense that all levels are known before the session begins and are not recalculated as price moves. That does not make them predictive — the inputs are entirely historical. Think of them as a map drawn in advance rather than a forecast of which road price will take.
Q. Do pivot points work on a 1-hour chart?
Daily pivots are commonly applied to intraday charts from 1 minute to 1 hour, and the hourly chart is a reasonable fit for swing-oriented intraday work. On a 1-hour chart, however, only a handful of clean level interactions occur each week, as the SOL example above shows. For longer holding periods, weekly or monthly pivots usually give more relevant structure.
Key takeaways
- Pivot points are mechanically derived levels — P = (H + L + C)/3 from the prior session, with resistances and supports projected from the prior range — so every trader using the same settings sees the same lines.
- R2/S2 sit one full range from the pivot, and R3/S3 sit one further range beyond R1/S1 — not one range beyond the prior high and low.
- The central pivot functions as a session bias line, and behavior at a level is the signal, not the level itself: rejection means it held, acceptance means it has flipped roles.
- Regime decides the application — fade outer levels in balanced markets, trade continuation through them in trending ones, and use a trend filter to tell the two apart.
- In the SOL/USDT 1-hour window examined, the central pivot was touched on 46 bars while R2 was touched on only 2, and both R1 breakouts faded within a day; that is one illustration on one market, not evidence of an edge.
Educational material. Charts use real SOL/USDT perpetual prices; past behaviour does not predict future results. Not investment advice.