Indicator & technique library · Indicator library
Money Flow Index (MFI) Explained: Formula and Settings
At a glance
- The Money Flow Index is a bounded 0–100 oscillator that weights each bar's price change by its volume.
- It is usually attributed to Gene Quong and Avrum Soudack, who described it as a volume-weighted version of Wilder's RSI.
- The standard setting is 14 periods with 80 and 20 as the extreme reference levels.
- MFI is most useful for spotting exhaustion and divergence in ranges; in strong trends it can stay extreme for a long time.
The Money Flow Index (MFI) is a momentum oscillator that moves between 0 and 100 and asks a simple question: over the last N bars, how much of the traded value happened on bars that closed higher versus bars that closed lower? Because it multiplies price by volume, it reacts to how much was transacted behind a move, not just to the move itself.
Traders care about MFI because it is the closest thing to an RSI that knows about participation. A rally on thin volume and a rally on heavy volume look identical to RSI; they look quite different to MFI. That makes it a useful second opinion when you are trying to judge whether a push is backed by real flow or is drifting on fumes.
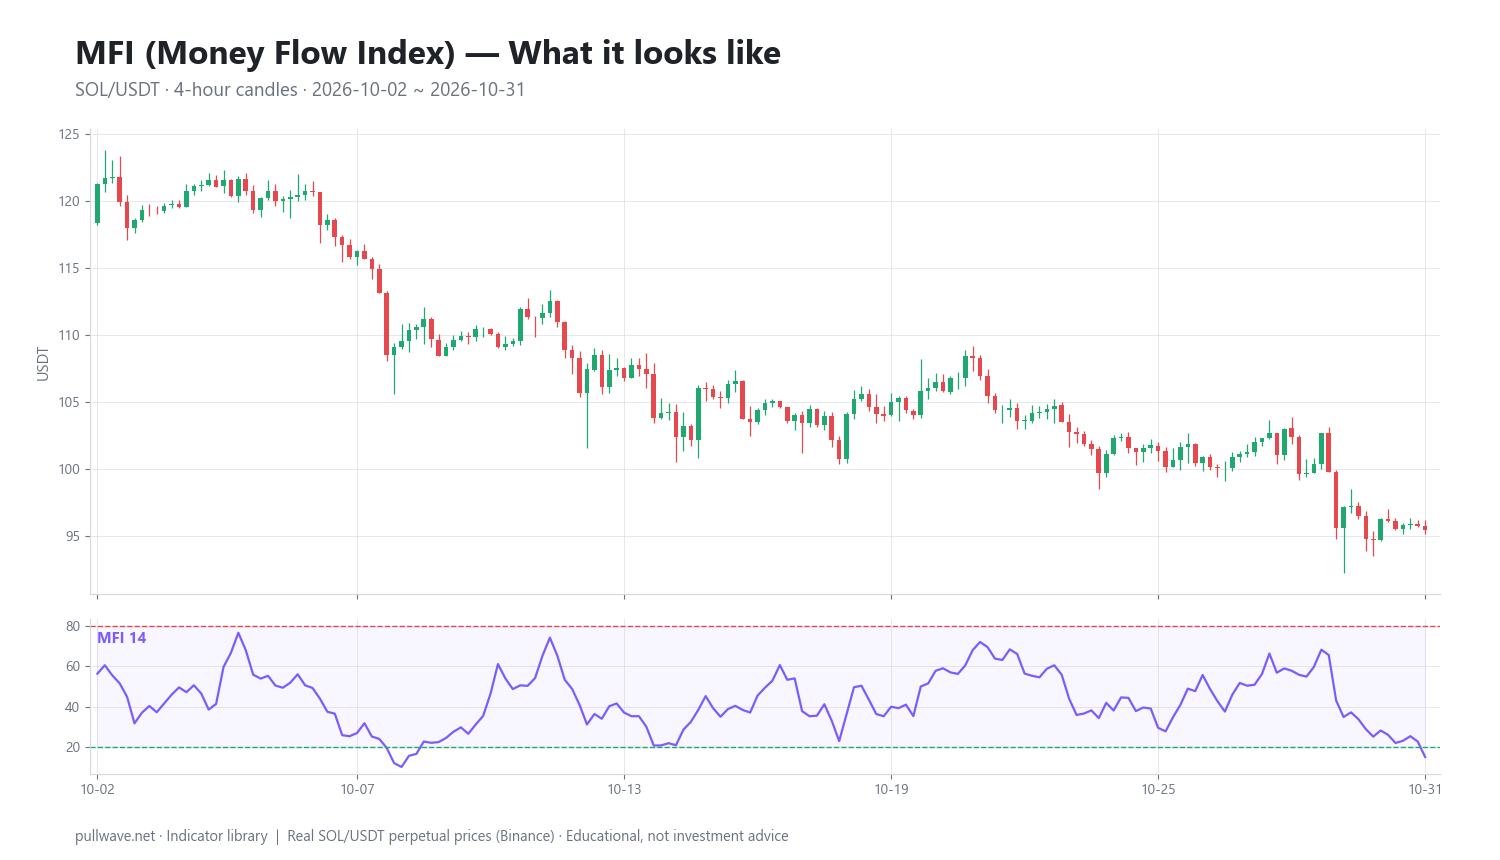
Figure 1 shows MFI with its default 14-period setting plotted under SOL/USDT perpetual 4h candles for October 2026. The oscillator panel sits below the price panel, with horizontal reference lines at 80 and 20 marking the zones traders conventionally call overbought and oversold.
What is MFI (Money Flow Index)?
MFI is a bounded oscillator built from typical price and volume. For each bar it computes a "raw money flow" — the typical price multiplied by the volume — and labels that flow positive or negative depending on whether the typical price rose or fell compared with the previous bar. It then compares the sum of positive flows to the sum of negative flows over a lookback window and expresses the result on a 0–100 scale.
A reading near 100 means almost all of the money that changed hands in the window did so on up bars. A reading near 0 means the opposite. A reading near 50 means buying and selling pressure, weighted by value traded, were roughly balanced.
Because of the structure of the formula, MFI is sometimes called a volume-weighted RSI. That description is accurate in spirit: swap volume-weighted money flow for Wilder's up-and-down price changes, and you get essentially the same mathematical shape.
The idea behind it (theory and history)
The Money Flow Index is commonly attributed to Gene Quong and Avrum Soudack, who presented it in Technical Analysis of Stocks & Commodities magazine in the late 1980s as a volume-weighted adaptation of J. Welles Wilder's Relative Strength Index. Wilder had introduced RSI in his 1978 book New Concepts in Technical Trading Systems; MFI keeps his normalization method and adds the volume dimension.
The theory is straightforward. Price alone tells you the direction of the last transaction. Price times volume tells you how much capital was committed at that price. If prices are rising but the value traded on up bars is shrinking relative to down bars, the advance is being carried by fewer and fewer dollars — a condition that often precedes a stall, though it certainly does not have to.
MFI belongs to the same family as on-balance volume, the Chaikin Money Flow and the accumulation/distribution line. What distinguishes MFI is that it is bounded. OBV and A/D are cumulative and unbounded, which makes them hard to compare across assets and periods. MFI's 0–100 range makes thresholds and cross-market comparisons practical.
One honest caveat about the theory: "money flow" is a metaphor. No money flows into or out of a market when a trade occurs — there is a buyer and a seller for every contract. What MFI actually measures is the distribution of traded value across up bars and down bars. That is a real and useful statistic, but it is not a measurement of capital entering an asset.
How it is calculated
Step by step, for each bar:
- Typical price. Add the high, low and close and divide by three.
- Raw money flow. Multiply the typical price by the bar's volume.
- Classify the flow. If today's typical price is higher than the previous bar's typical price, the raw money flow is positive. If it is lower, it is negative. If the two typical prices are identical, the bar is normally discarded (counted as neither).
- Sum over the lookback. Add the positive money flows over the last 14 bars, and separately add the negative money flows over the same 14 bars.
- Money flow ratio. Divide the positive sum by the negative sum.
- Normalize. Convert the ratio into a 0–100 reading with Wilder's formula.
``` TP = (High + Low + Close) / 3 RMF = TP * Volume PMF = sum of RMF over last N bars where TP > TP[1] NMF = sum of RMF over last N bars where TP < TP[1] MFR = PMF / NMF MFI = 100 - (100 / (1 + MFR))
equivalently: MFI = 100 * PMF / (PMF + NMF) ```
Note the second form: MFI is simply the share of total classified money flow that occurred on up bars, expressed as a percentage. If negative money flow is zero over the window, MFI pins at 100; if positive money flow is zero, it pins at 0.
Unlike RSI, which uses Wilder's smoothed (exponential-style) average, MFI uses a plain rolling sum. That makes it more reactive: a single enormous volume bar can move the reading sharply and then drop out of the window N bars later, causing a jump that has nothing to do with current price action.
Default settings and variations
The standard setting is 14 periods, inherited directly from Wilder's RSI. Wilder worked with daily data and chose 14 as roughly half of a monthly cycle; there is nothing magical about it, and it survived mostly through convention and because it balances responsiveness against noise reasonably well.
The standard extreme levels are 80 and 20, wider than RSI's usual 70/30. The reason is practical: volume weighting makes MFI noisier, so it visits extremes more often than RSI at the same thresholds, and the wider bands filter some of that.
| Setting | Typical use | Trade-off |
|---|---|---|
| MFI 9–10 | Short-term, lower timeframes | More signals, more noise, frequent extremes |
| MFI 14 (default) | General purpose, all timeframes | Balanced; the setting most other traders watch |
| MFI 20–25 | Swing and position context | Smoother, fewer extremes, later turns |
| Levels 80/20 | Standard | Reasonable in ranges; too tight in strong trends |
| Levels 90/10 | Trending or very volatile markets | Rare signals, but less noise |
Some platforms let you choose the price input (close instead of typical price) or add a signal-line average of MFI. Both are reasonable variations, but they change the readings, so a level of 20 on one chart is not exactly 20 on another. Check what your charting tool actually computes before comparing notes with someone else.
In crypto, the source of volume matters more than the length setting. Volume on a single exchange's perpetual contract is not the same series as aggregated spot volume, and both differ from a venue's own spot book. The same MFI 14 can look materially different on SOL/USDT perps than on SOL/USD spot. Pick one consistent data source and stay with it.
How to read it
Read MFI in three layers, in this order:
- Level. Above 80 means up bars dominated the value traded over the window; below 20 means down bars dominated. These are descriptions of what happened, not forecasts.
- Direction and slope. A rising MFI from 30 to 55 says participation is rotating toward up bars. A falling MFI from 85 to 60 says the opposite, even though the level is still high.
- Relationship to price. Divergence — price making a higher high while MFI makes a lower high, or vice versa — is the signal most MFI users actually watch, because it is where the volume weighting adds information that price alone does not carry.
The 50 line is a useful but underrated reference. Persistent readings above 50 across many bars describe a market where buyers keep absorbing supply; repeated failures under 50 describe the reverse. Many traders use the 50 line as a rough regime filter and reserve 80/20 for timing context.
Also watch how long MFI spends at extremes. In the SOL window in the example below, MFI 14 was beyond the 80/20 bands on only 3.3% of bars. A market where the oscillator lives above 80 for days is in a different regime from one that touches it twice a month, and the same reading means different things in each.
How traders use it
1. Exhaustion context in ranges. When price is oscillating within a defined band, MFI pushing below 20 near support or above 80 near resistance can mark the point where one side has spent its volume. Works when the market is clearly rotating between levels. Fails at the start of a breakout, when the first extreme reading is the beginning of the move, not the end of it.
2. Divergence. A new price high accompanied by a lower MFI high suggests the advance is being financed by less value traded than the previous one. Works best at the tail end of extended moves on higher timeframes. Fails often on 5m and 15m crypto charts, where divergences appear constantly and most resolve into nothing. Divergence is a warning about momentum quality, never a timing tool on its own.
3. Trend-pullback context. In an established uptrend, dips that take MFI to the 30–40 area — without the trend structure breaking — describe pauses rather than reversals. Works when higher-timeframe structure is intact. Fails when the trend is ending, which is precisely when the same reading appears and keeps going lower.
4. Failure swings. MFI drops below 20, bounces back above it, pulls back without making a new low, then exceeds its bounce high. This is Wilder's failure-swing idea applied to MFI and it requires no price reference at all. Works as a structural confirmation that the extreme is losing force. Fails in high-volatility conditions where MFI whipsaws through the band repeatedly.
For crypto specifically: 24/7 trading means there are no session breaks to reset volume patterns, and weekend volume is structurally thinner. A low-volume weekend can shrink raw money flow on both sides and leave MFI jumpy. On perpetual futures, liquidation cascades produce single bars with extreme volume that dominate the 14-bar sum and then vanish from it, so MFI can reset abruptly without any corresponding price event.
Example on a real SOL chart
The window below is SOL/USDT perpetual on Binance, 4h candles, 2 October to 31 October 2026, with MFI 14 and the standard 80/20 levels. This is one market over one month — an illustration of how the readings line up, not evidence that the indicator predicts anything.
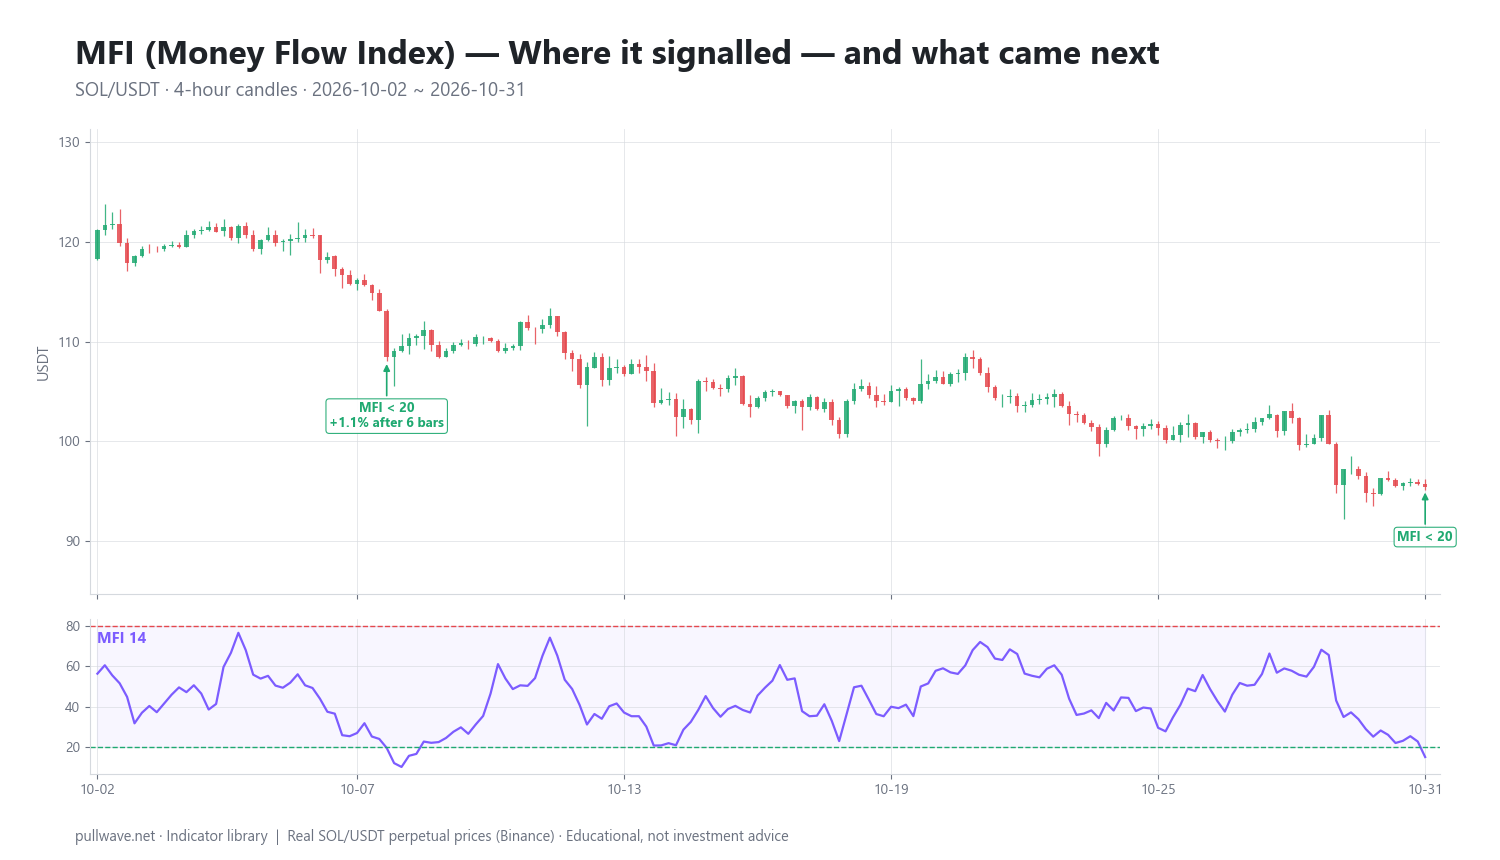
Figure 2 marks each threshold event in the window and labels the percentage move after 6 bars (one day) and 18 bars (three days) on the 4h timeframe.
In those 30 days, MFI 14 crossed below 20 exactly twice — the only two extreme events in the window — and spent 3.3% of all bars outside the 80/20 bands.
| Date (UTC) | Signal | Price | After 6 bars | After 18 bars |
|---|---|---|---|---|
| 2026-10-08 12:00 | MFI < 20 | 108.50 | +1.07% | +3.17% |
| 2026-10-31 20:00 | MFI < 20 | 95.44 | — | — |
The first event, on 8 October at 108.50, was followed by a small bounce: +1.07% after 6 bars and +3.17% after 18 bars. That is a move in the direction a mean-reversion reader would expect, but it is modest — well inside the normal 4h range for SOL — and one observation tells you nothing reliable. The summary statistic here is 1 of 1 events moving in the signal direction at the measured horizon, which is a sample so small it should not influence anyone's expectations.
The second event sits at the very end of the window: the final 4h close of 31 October at 95.44, with MFI at 15.07. There is no forward data for it inside this window, so it is simply an open observation. It is also worth noting the context: price at that last signal was roughly 12% below the price at the first one, so an oversold MFI reading in early October did not prevent a materially lower price three weeks later.
That is the honest lesson of this window. Two extreme readings, one followed by a small bounce, one unresolved, inside a market that trended lower overall. MFI described participation accurately; it did not hand anyone a forecast.
Common mistakes
- Treating 20 and 80 as signals. They are descriptions of recent flow distribution. In a strong trend, MFI can sit above 80 or below 20 for many consecutive bars while price keeps going.
- Counter-trading extremes without structure. An oversold MFI inside a downtrend is the normal condition of a downtrend, not a contradiction of it.
- Trading divergence in isolation. Divergences on low timeframes in crypto are extremely common and mostly resolve into continuation. They need a level, a structure break or a higher-timeframe reference to mean much.
- Ignoring the volume source. Running MFI on an illiquid pair, a new listing, or a venue whose volume series has gaps produces readings that are mathematically valid and practically meaningless.
- Forgetting the rolling-sum artifact. A huge volume bar leaving the 14-bar window can shift MFI noticeably with no new price information. Check whether a jump corresponds to a current bar or to an old one dropping out.
- Over-tuning the length. Finding that MFI 11 would have worked better last month is curve fitting, not research.
Combining it with other tools
MFI answers one narrow question, so it pairs best with tools that answer different ones.
With trend context. A long moving average, higher-timeframe market structure, or simply the slope of price over the last 100 bars tells you whether to read MFI extremes as exhaustion (ranges) or as continuation (trends). Without that filter, the 80/20 levels mislead more often than they help.
With horizontal levels. An MFI extreme that occurs at a well-tested support or resistance area carries more context than the same reading in the middle of a range. The level provides the location; MFI provides the participation story.
With plain RSI. Comparing MFI and RSI side by side isolates the volume contribution. When RSI is making a higher high and MFI is not, the price momentum is intact but the value traded behind it is thinning. That contrast is more informative than either line alone.
With volatility measures. ATR or Bollinger Band width tells you whether a 3% move is large or routine for the current regime. In the SOL example, knowing that +3.17% over three days is unremarkable for 4h SOL is essential to interpreting the event sensibly.
With volume itself. Keep a raw volume histogram visible. MFI compresses volume into one number; the histogram shows you whether that number is driven by one liquidation spike or by sustained participation — a distinction that matters a great deal on perpetual futures.
Frequently asked questions
Q. What is the best MFI setting for crypto?
There is no setting that is best in all conditions. MFI 14 with 80/20 levels is the standard and is what most other participants are looking at, which is itself a reason to start there. Traders working on lower timeframes sometimes shorten to 9 or 10 and widen the bands to 90/10 to cut noise, but shorter lengths produce more extremes and more false reads.
Q. What is the difference between MFI and RSI?
RSI measures the balance of up-moves and down-moves in price only. MFI measures the same balance but weights each bar by its traded value (typical price times volume), so heavy-volume bars count more than quiet ones. MFI also uses a plain rolling sum rather than Wilder's smoothing, which makes it more reactive than RSI at the same length.
Q. What does an MFI reading below 20 mean?
It means that over the last 14 bars, less than 20% of the classified money flow occurred on bars whose typical price rose — selling bars dominated the traded value. It is a description of recent conditions, not a prediction of a reversal. In a sustained downtrend, MFI can remain below 20 for extended stretches.
Q. Does MFI work on perpetual futures?
It can be calculated on any series that has high, low, close and volume, so perpetual contracts qualify. The caveat is that perp volume is venue-specific and includes leveraged liquidation flow, so a single cascade bar can dominate the 14-bar sum. Compare readings only within the same contract and the same data source.
Q. Is MFI a leading or lagging indicator?
MFI is built entirely from past bars, so it is lagging by construction. Divergence between price and MFI is sometimes called leading because it can appear before a turn, but divergences also appear frequently before continuations, so they are best treated as a condition to watch rather than an early signal.
Q. Can MFI be used on 5-minute or 15-minute crypto charts?
Yes, and many intraday traders do, but expect a much higher rate of extreme readings and divergences that go nowhere. Lower timeframes in crypto are dominated by short-lived volume bursts that distort the money flow sums. If you use MFI intraday, anchor it to a higher-timeframe trend read and widen the thresholds.
Key takeaways
- MFI is a 0–100 oscillator that weights price direction by traded value; it is usually described as a volume-weighted RSI and is attributed to Gene Quong and Avrum Soudack.
- The calculation is typical price × volume, split into positive and negative sums over 14 bars, normalized with Wilder's formula to a 0–100 scale.
- Default 14 periods and 80/20 levels are conventions, not optimized values; the wider bands exist because volume weighting makes MFI noisier than RSI.
- Extremes mean exhaustion in ranges and continuation in trends, so an MFI reading is only interpretable alongside a trend and structure read.
- In the SOL/USDT 4h window shown, MFI 14 produced just two sub-20 events in a month and spent 3.3% of bars at extremes — one small bounce, one unresolved reading at a price well below the first. One window on one market proves nothing either way.
Educational material. Charts use real SOL/USDT perpetual prices; past behaviour does not predict future results. Not investment advice.