Basics course · Lesson 24 · Part 3 · Trend and price structure
Reading Trading Volume: The Basics
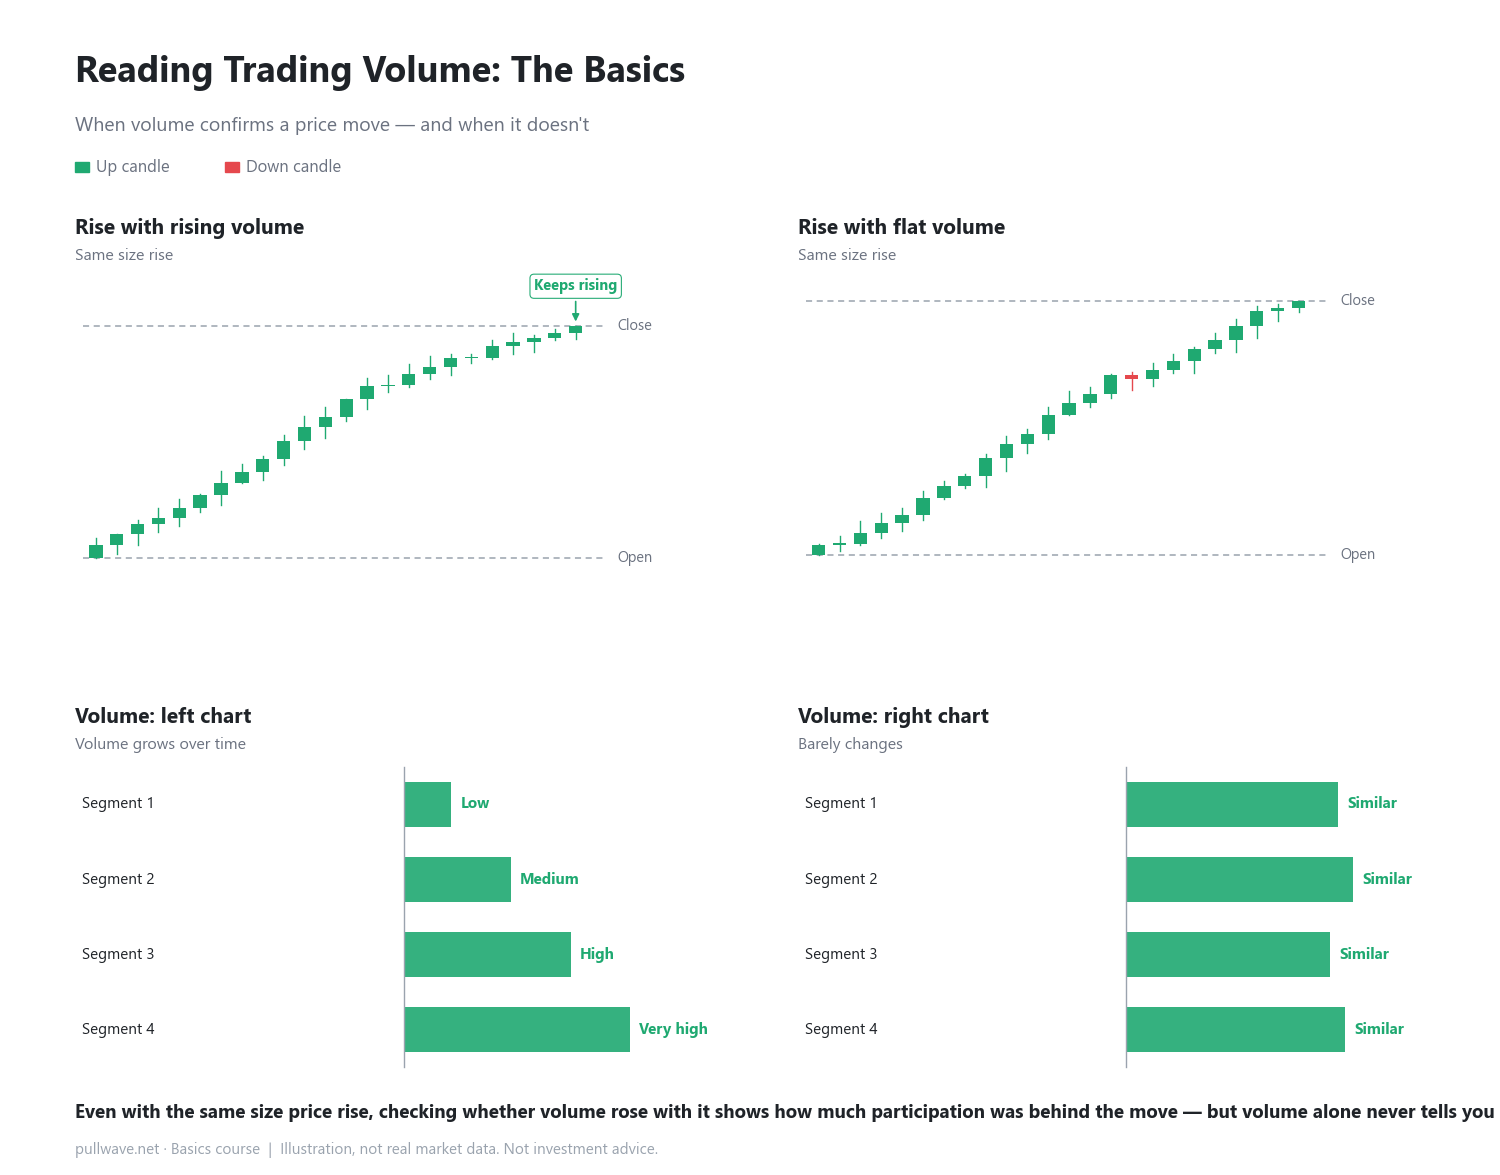
At a glance
- Volume shows how much was traded, not where price is headed
- When volume rises with a price move, more participation was likely involved
- Volume alone never tells you which direction price will go next
In the last lesson, we looked at why trend tools often fail in a sideways market. This time, let's cover another piece of information that always travels alongside price: trading volume. Volume is simply a number that shows how much was traded in a given period. It doesn't tell you where price is heading, but it helps you gauge how much participation was behind a move.
What volume actually shows
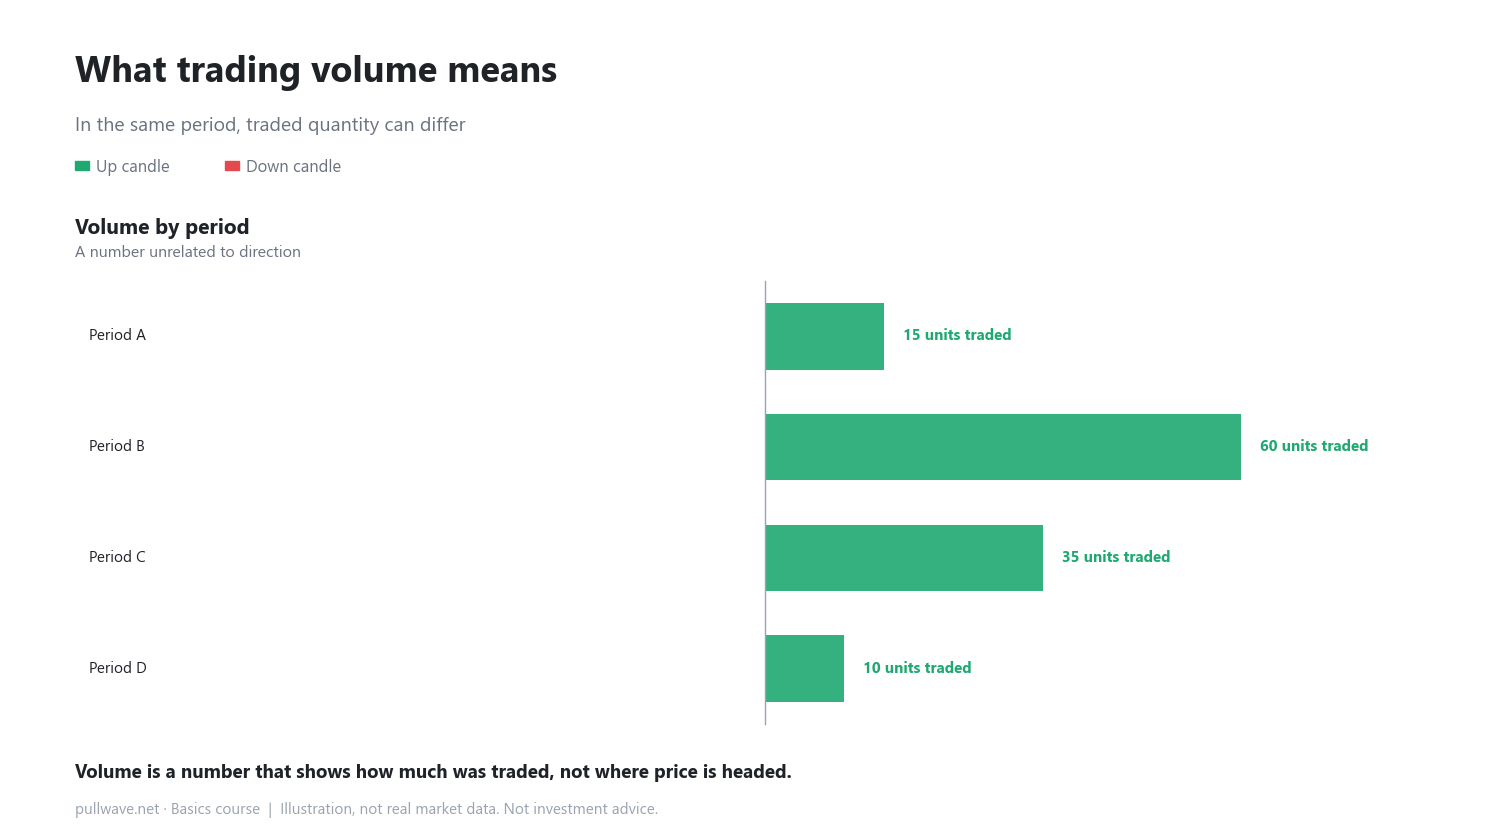
Volume = quantity traded
Volume is the total amount bought and sold over a specific period. For example, if 15 units traded in one period and 60 units traded in the next, that second period clearly had more participants involved. This number is completely separate from whether price went up or down.
When volume confirms a price move
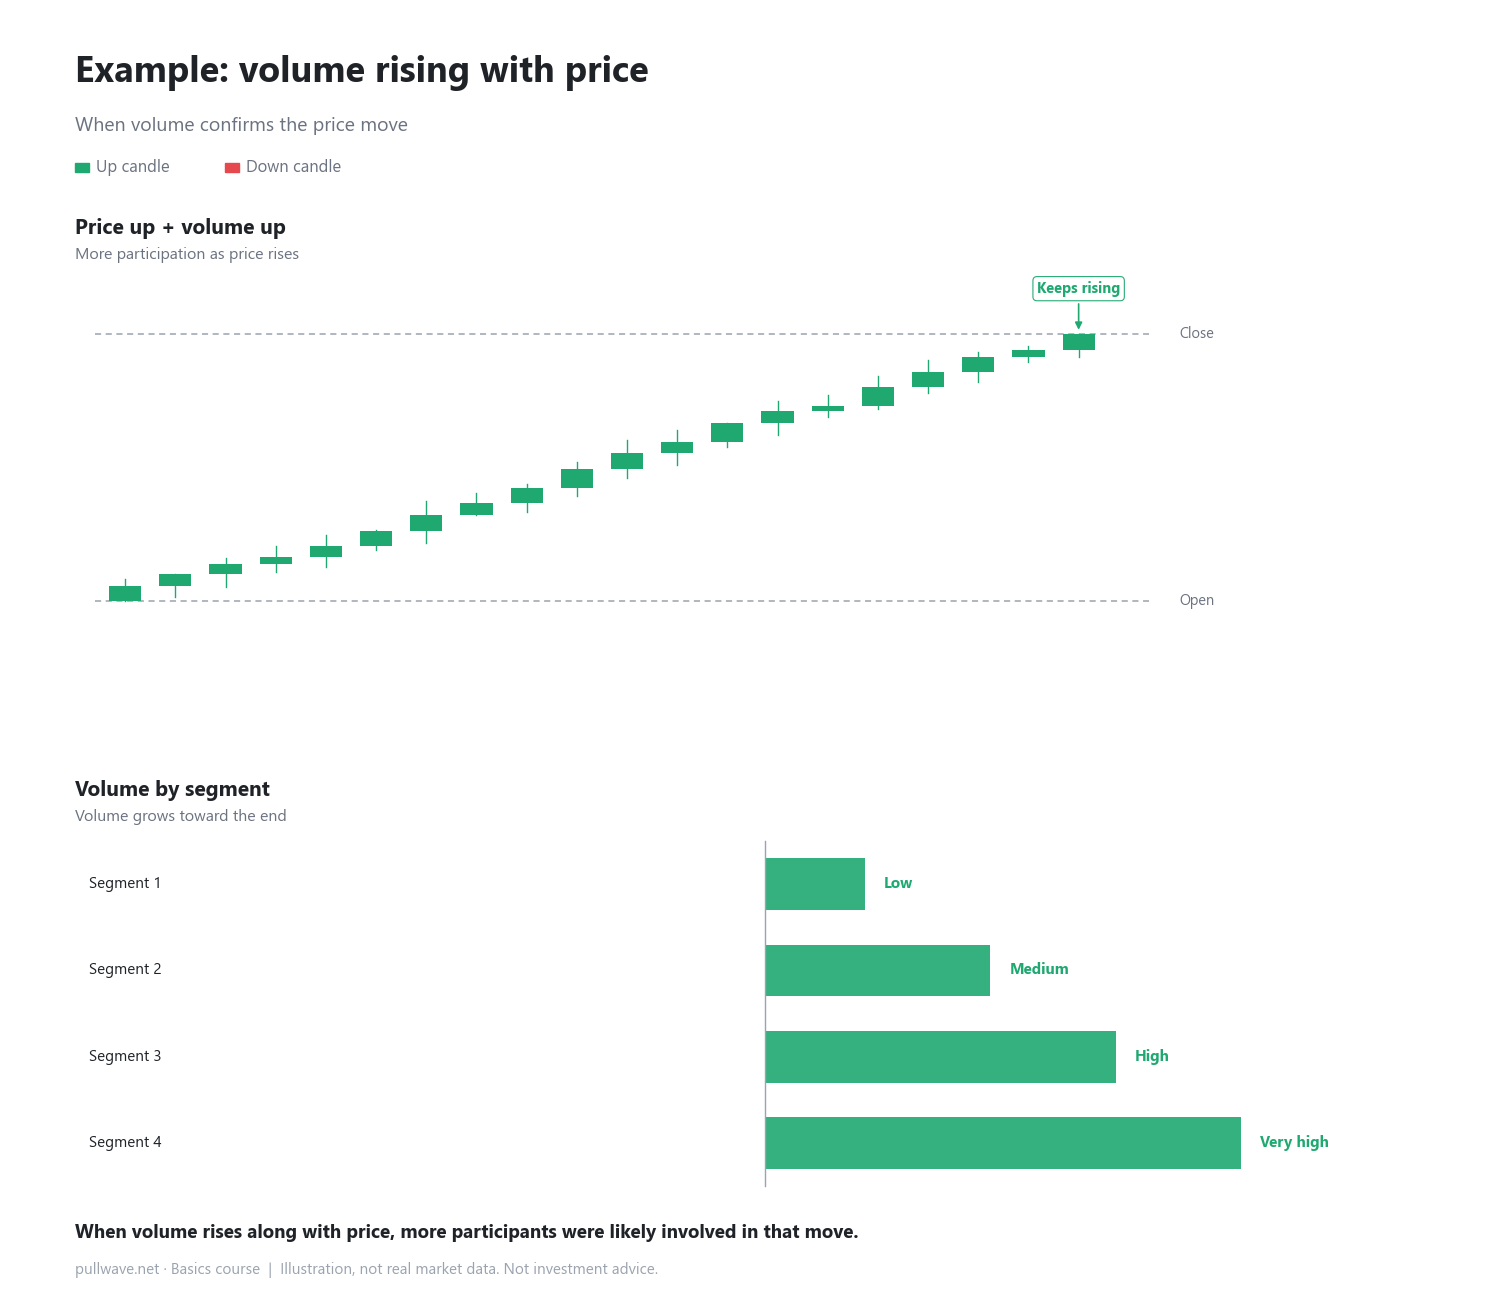
Sometimes price moves in one direction while volume rises along with it. Say price climbs from 100 to 112 while volume across four segments goes 20 → 45 → 70 → 95. That pattern suggests growing participation behind the rise. In general, this kind of pattern is read as more capital and attention flowing into that move.
When volume doesn't confirm a price move
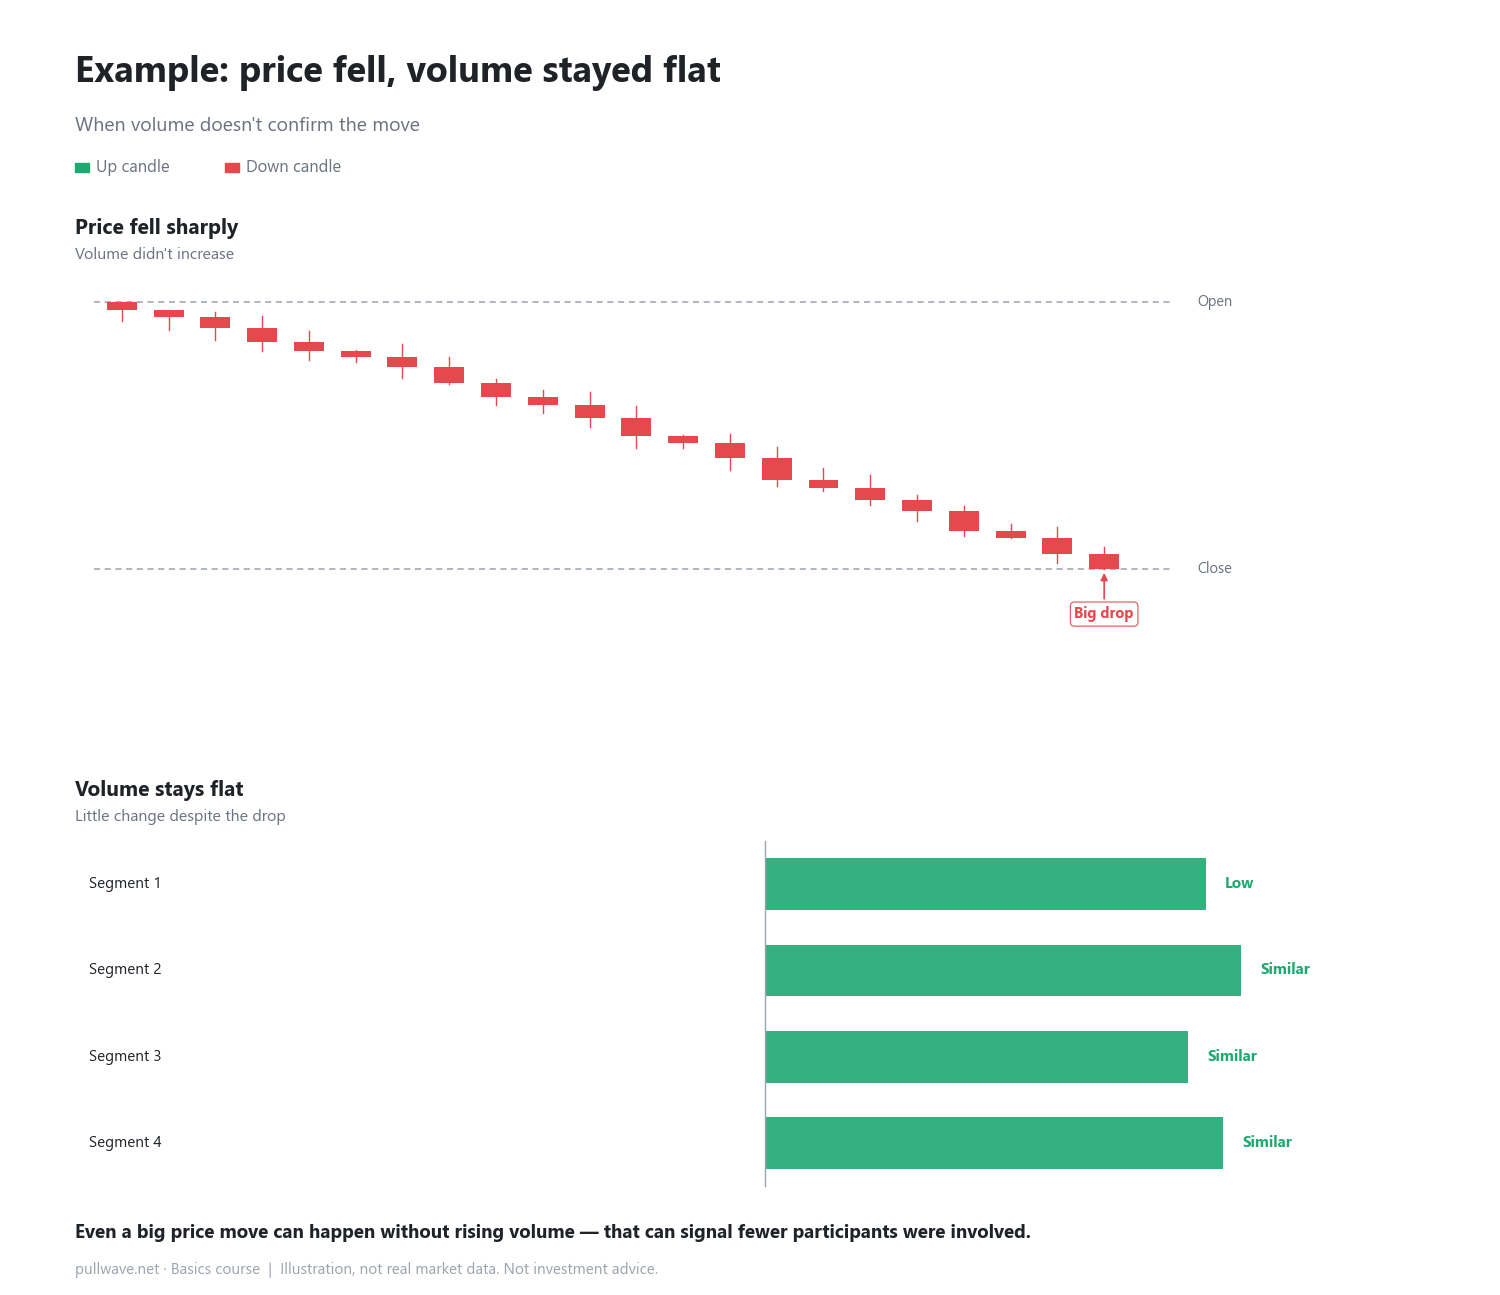
On the other hand, price can move a lot while volume barely changes. If price falls from 100 to 82 but volume across the same four segments stays around 25 → 27 → 24 → 26, that drop likely involved relatively few participants. Even a move of the same size can have a very different character depending on whether volume backed it up.
Volume alone never tells you direction
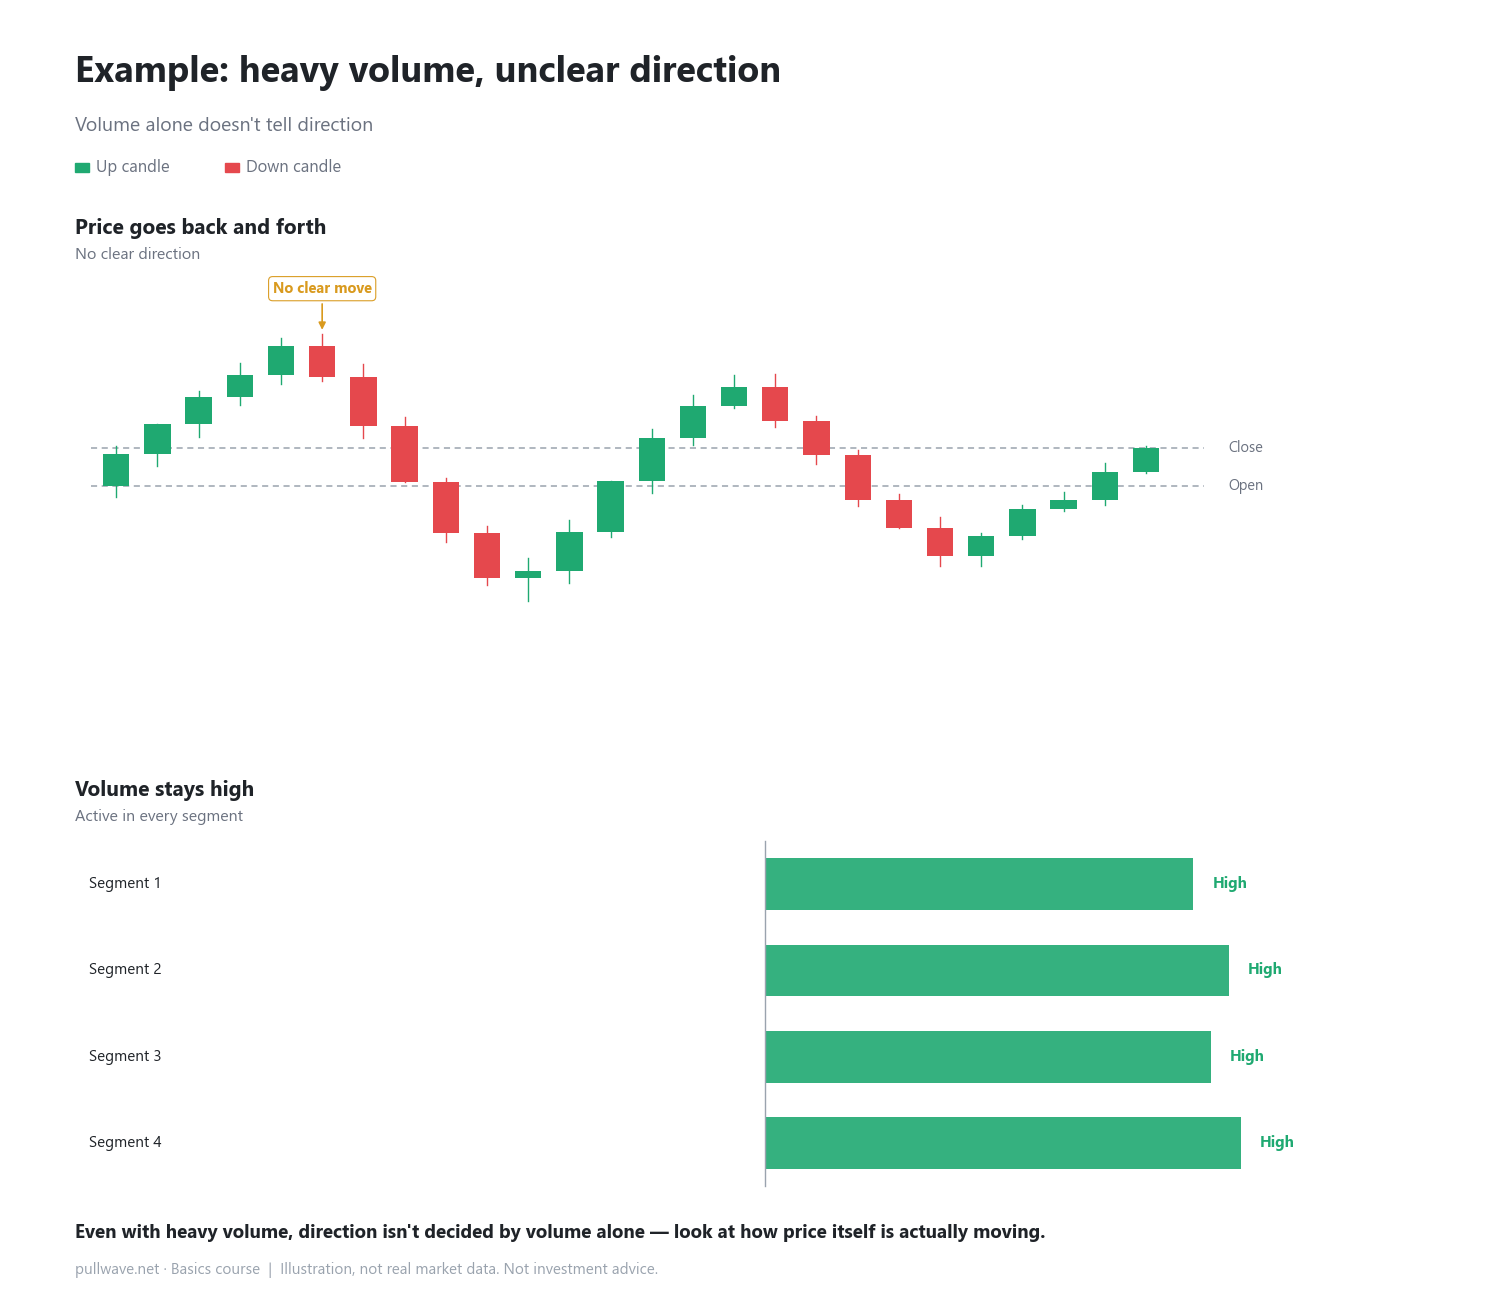
Here's the key point to remember: high volume doesn't mean price will rise, and it doesn't mean price will fall either. Volume only tells you that activity happened — the direction has to come from price itself. Volume can stay high the entire time while price swings back and forth with no clear direction at all.
How to use it on a real chart
On most real charts, volume bars sit right below the candles. When you spot a segment where price moved a lot, check whether the volume bars there are noticeably taller than usual. Taller bars suggest more participation behind that move; bars that stay about the same height suggest a relatively quiet move. Keep in mind this only helps you gauge how much activity was behind a move — it's not a signal for where price goes next.
Common misconceptions
- Some beginners assume rising volume points toward a specific direction. In reality, volume shows how much participation there was, not which way price will go.
- It's tempting to think every big price swing must come with a big jump in volume, but price can move significantly even when volume barely changes.
FAQ
What does it mean when volume is close to zero?
It means almost no trading happened in that period — participation or interest was likely low. If price moves only slightly on very low volume, it's reasonable to treat that move as relatively less significant.
How do I spot a period where volume is rising?
Compare the height of the volume bars to several previous periods rather than looking at a single bar in isolation. If the bars are noticeably taller than the recent average, that segment likely had more participation. Relative comparison matters more than the raw number itself.
General education, not investment advice. The picture is an illustration, not real market data.