Basics course · Lesson 23 · Part 3 · Trend and price structure
Why Trend and Breakout Methods Often Fail in Range Markets
At a glance
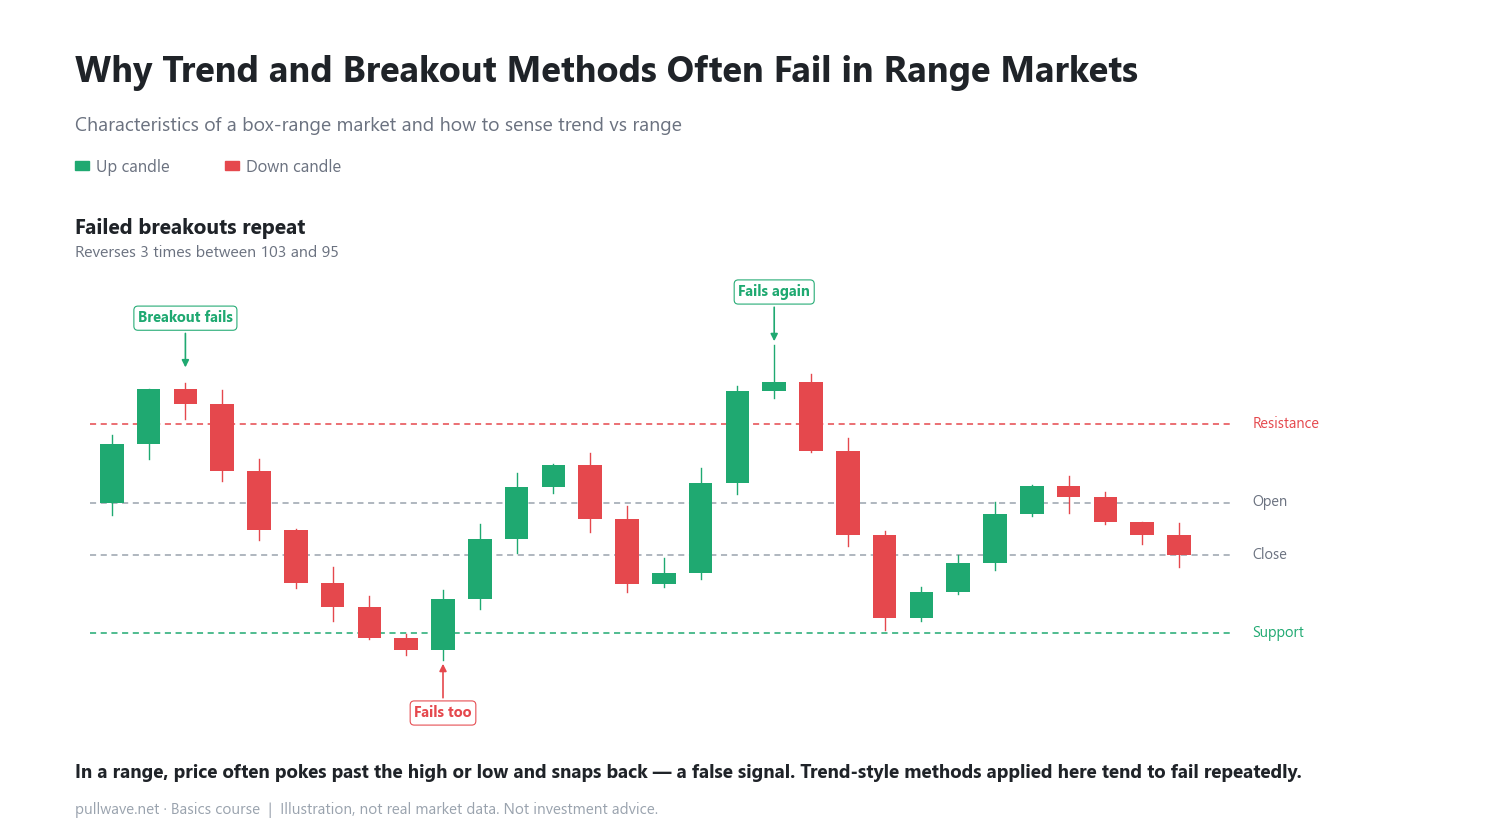
- A range market keeps bouncing between a resistance level and a support level.
- False breakouts are common in a range, which makes breakout and trend methods fail often.
- Watching the direction of highs and lows builds a sense for telling a trend apart from a range.
In the last lesson, we learned how to draw trendlines and their limits. Trendlines work well when a trend exists, but they tend to fail in a range, where price moves up and down without picking a clear direction. In this lesson, we'll look at why breakout and trend-following methods often fail inside that kind of range, called a range market or box range.
What a range market looks like
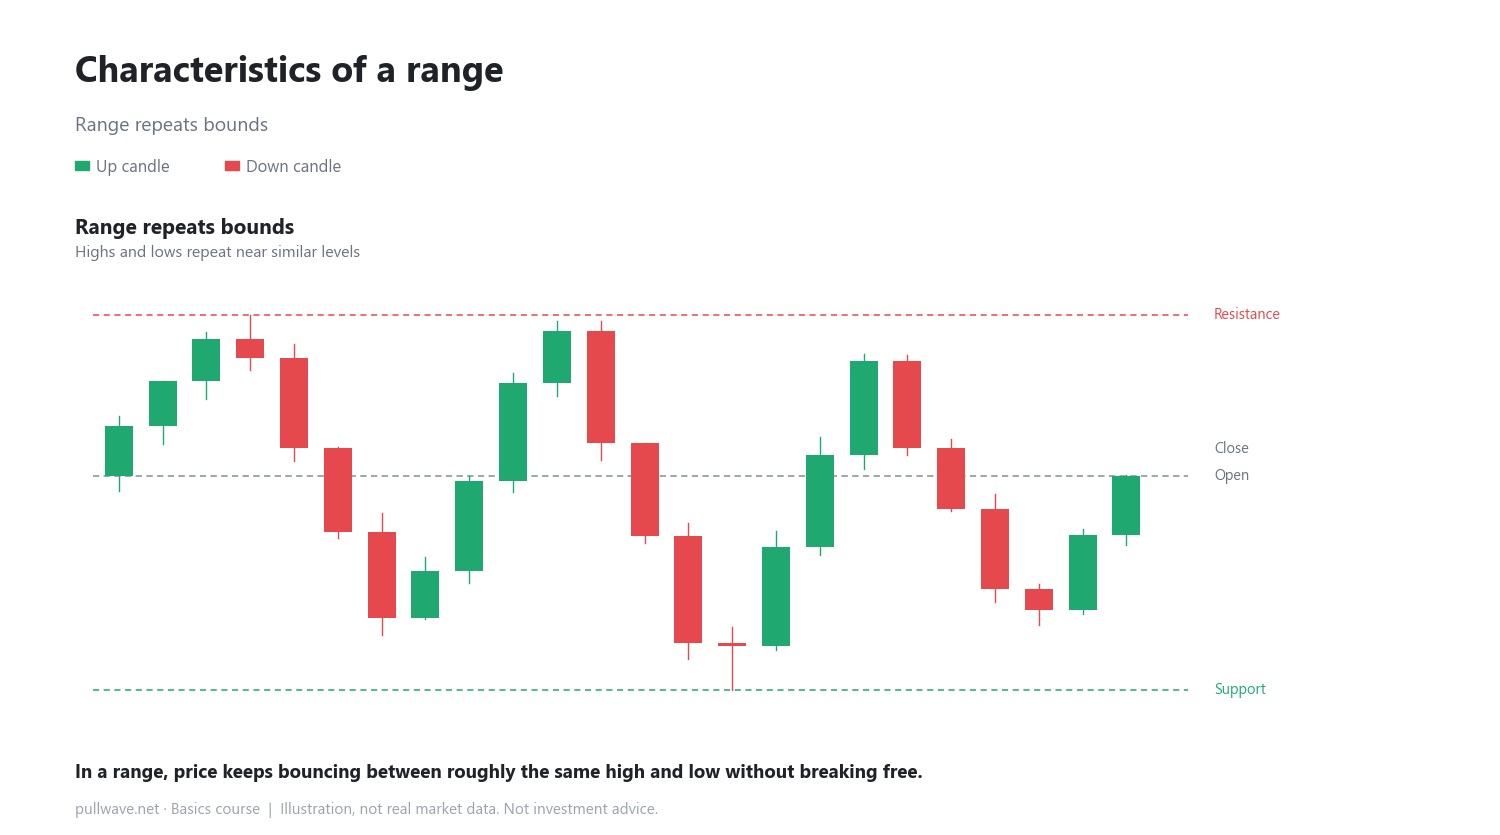
A range market is a zone where price keeps bouncing between a resistance level above and a support level below, without settling on a direction. Resistance is the upper price area where price has bumped into and turned back several times. Support is the lower area where price has been pushed back up from several times.
Characteristics of a range
In a range, highs and lows repeat around nearly the same levels. For example, if price gets stopped near 103 three times and gets supported near 96 twice, the zone between those levels is the range. Inside it, price rises then falls back, falls then rises back, over and over.
Why breakout methods often fail in a range
Breakout trading assumes that once price pushes through resistance, a new trend begins. But inside a range, price often pokes slightly above resistance and then snaps back inside almost immediately. This is called a false breakout (or fakeout).
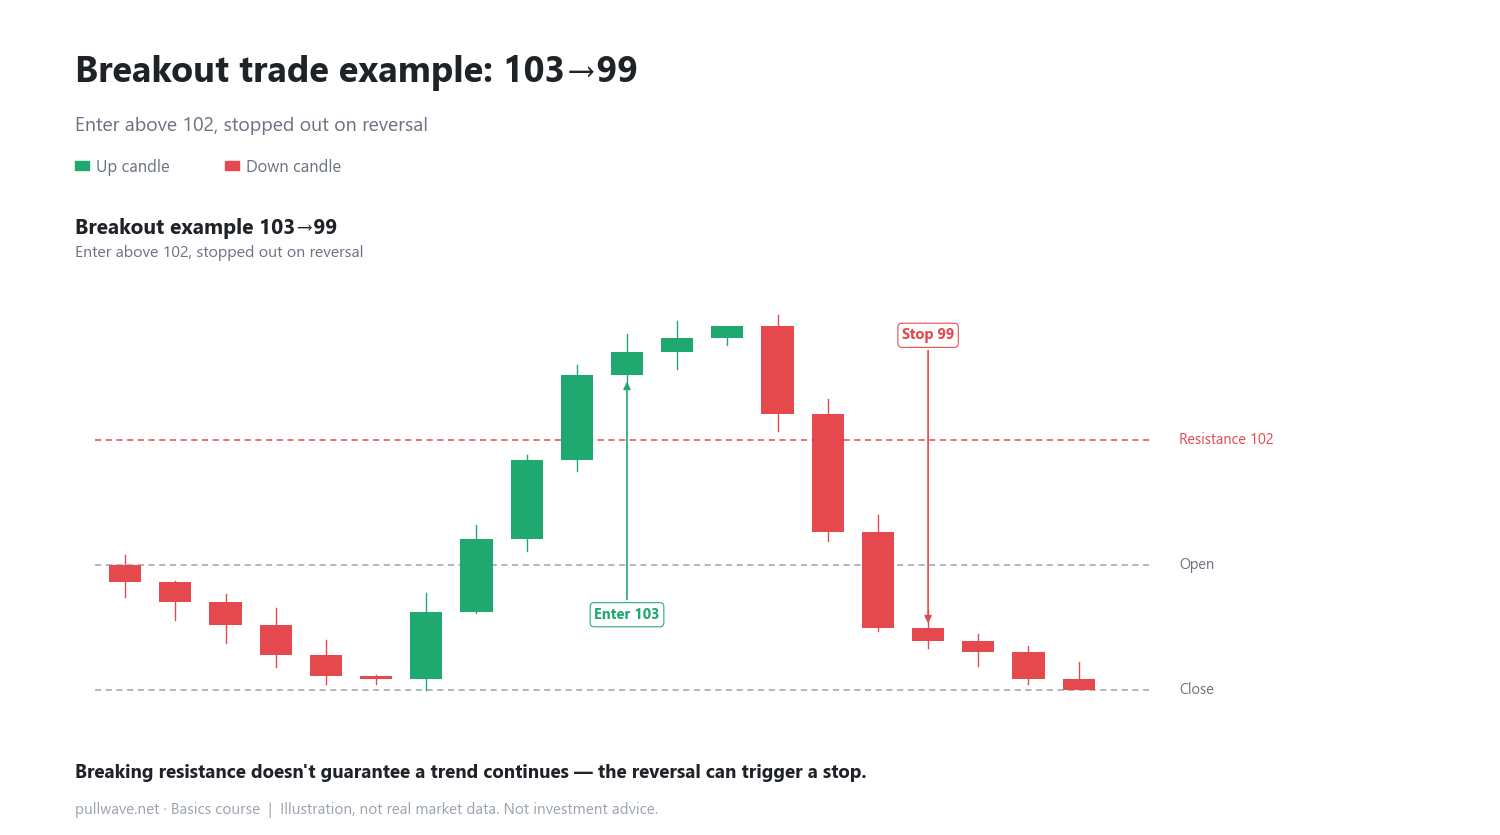
Here's a concrete example. Say resistance sits at 102, and price pushes up to 103. You read that as a breakout and enter. But price quickly drops back to 99 and you exit there — you bought at 103 and sold at 99, a 4-point loss. In a range, this kind of reversal can happen more than once. Applying breakout methods without adjustment makes these losses easy to repeat.
Developing a sense for trend vs range
The simplest way to tell them apart is to look at the direction of highs and lows. In a trend, both highs and lows keep moving in the same direction over time. In a range, both highs and lows stay within a similar band. A useful habit is to ask yourself: "Is this high higher than the last one? Is this low higher than the last one?" each time you look at a chart.
How to use it on a real chart
When you look at a real chart, first check whether the last few highs and lows cluster within a tight range. If price keeps stalling near the same levels, you're likely looking at a range market. In that setting, don't chase a breakout the moment it appears — check whether price has cleared the prior range by a meaningful margin, and whether other signals support the move. If, instead, highs and lows are clearly moving in one direction over time, you're closer to a trend, where breakout and trend-following methods tend to fit better.
Common misconceptions
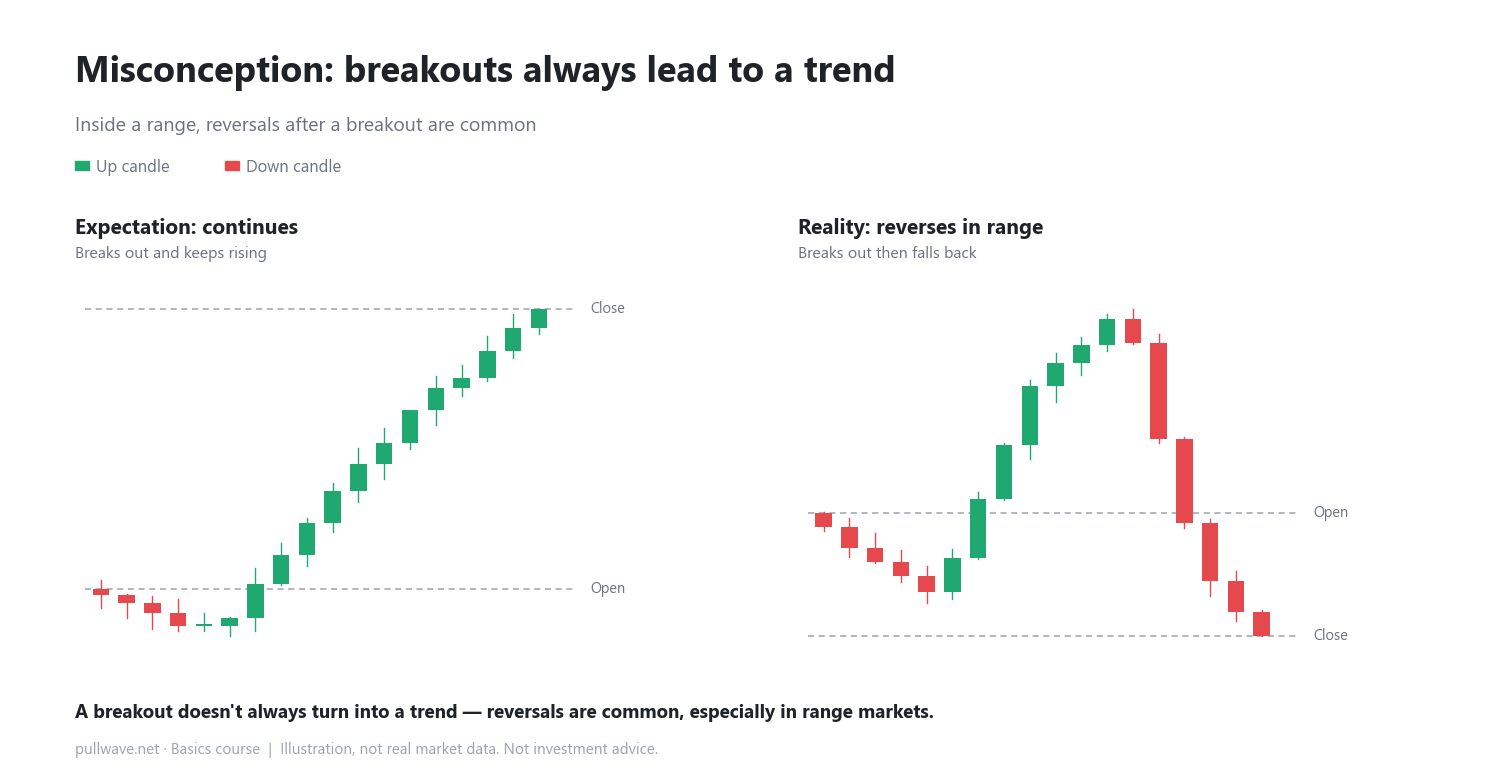
- It's easy to assume that any move past resistance guarantees a trend is starting. In a range, reversing right back inside after that move is very common.
- It's tempting to think a range is simpler to trade because there's "no direction." In practice, ranges often produce more false signals, which can make reading them harder than a clear trend.
FAQ
How do I tell whether I'm looking at a range or a trend?
Compare just the last few highs and lows. If there's no clear direction and they stay within a similar band, treat it as a range and proceed carefully. When you're unsure, avoid jumping to the conclusion that a breakout is automatically the start of a trend.
Should I avoid trading in a range market entirely?
Not necessarily. But a range usually calls for an approach built around movement within the boundaries, rather than a pure breakout or trend method. This lesson focuses on building the sense to recognize a range, rather than a specific set of rules for trading inside one.
General education, not investment advice. The picture is an illustration, not real market data.