Basics course · Lesson 22 · Part 3 · Trend and price structure
How to Draw a Trendline and Its Limits
At a glance
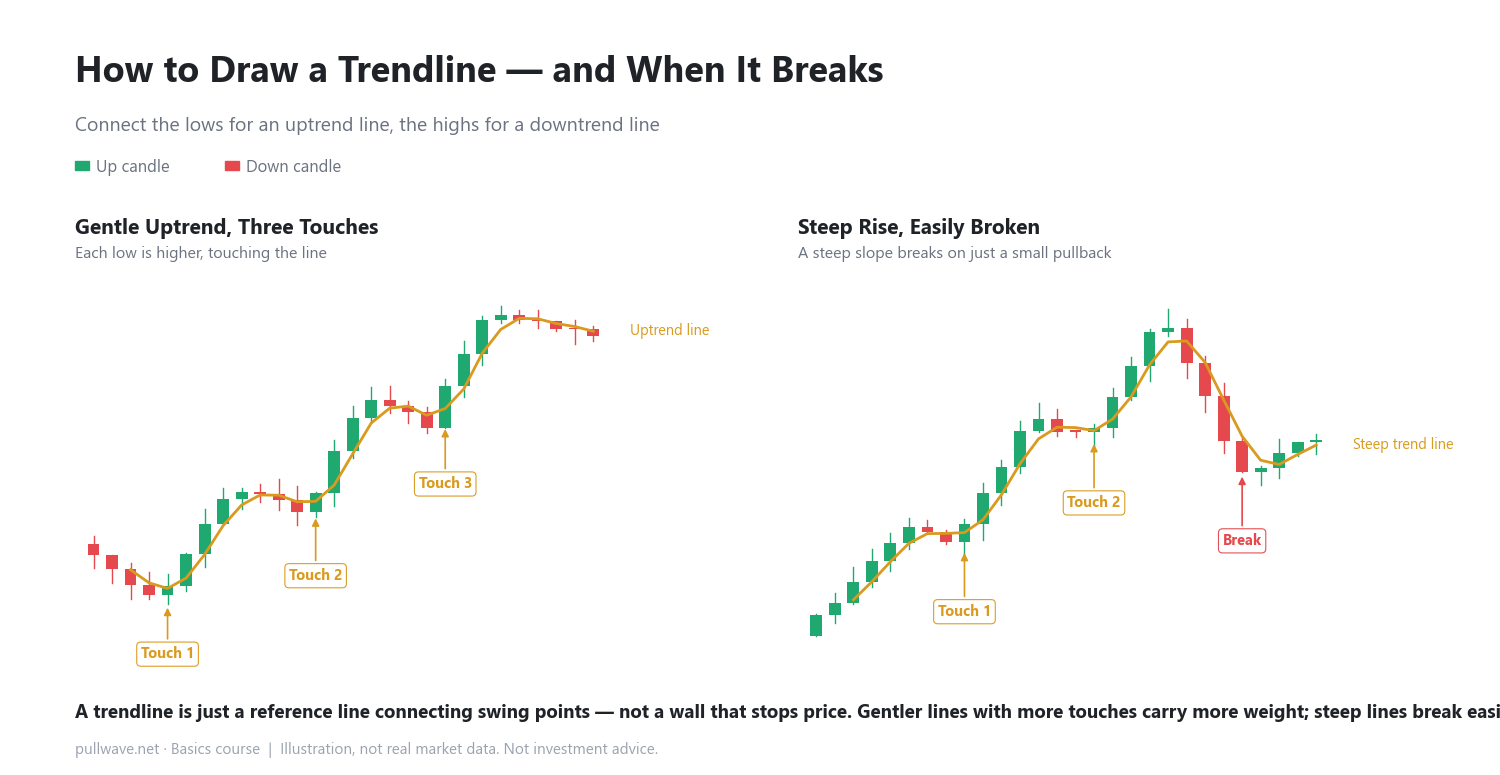
- Connect the lows for an uptrend line, the highs for a downtrend line
- More touches generally make a trendline more worth noting
- Steep trendlines tend to break on even small pullbacks
In the previous lesson, we looked at what fake breakouts tend to look like. One tool traders often use to judge whether a breakout is real is the trendline. In this lesson, we'll cover how to draw trendlines, and why they have real limits.
A trendline is a straight line drawn across either the lows or the highs on a chart. It isn't a magic line that predicts the future — think of it as a simple visual tool for tracking how price has moved so far.
Two Ways to Draw a Trendline
Uptrend line: connect the lows
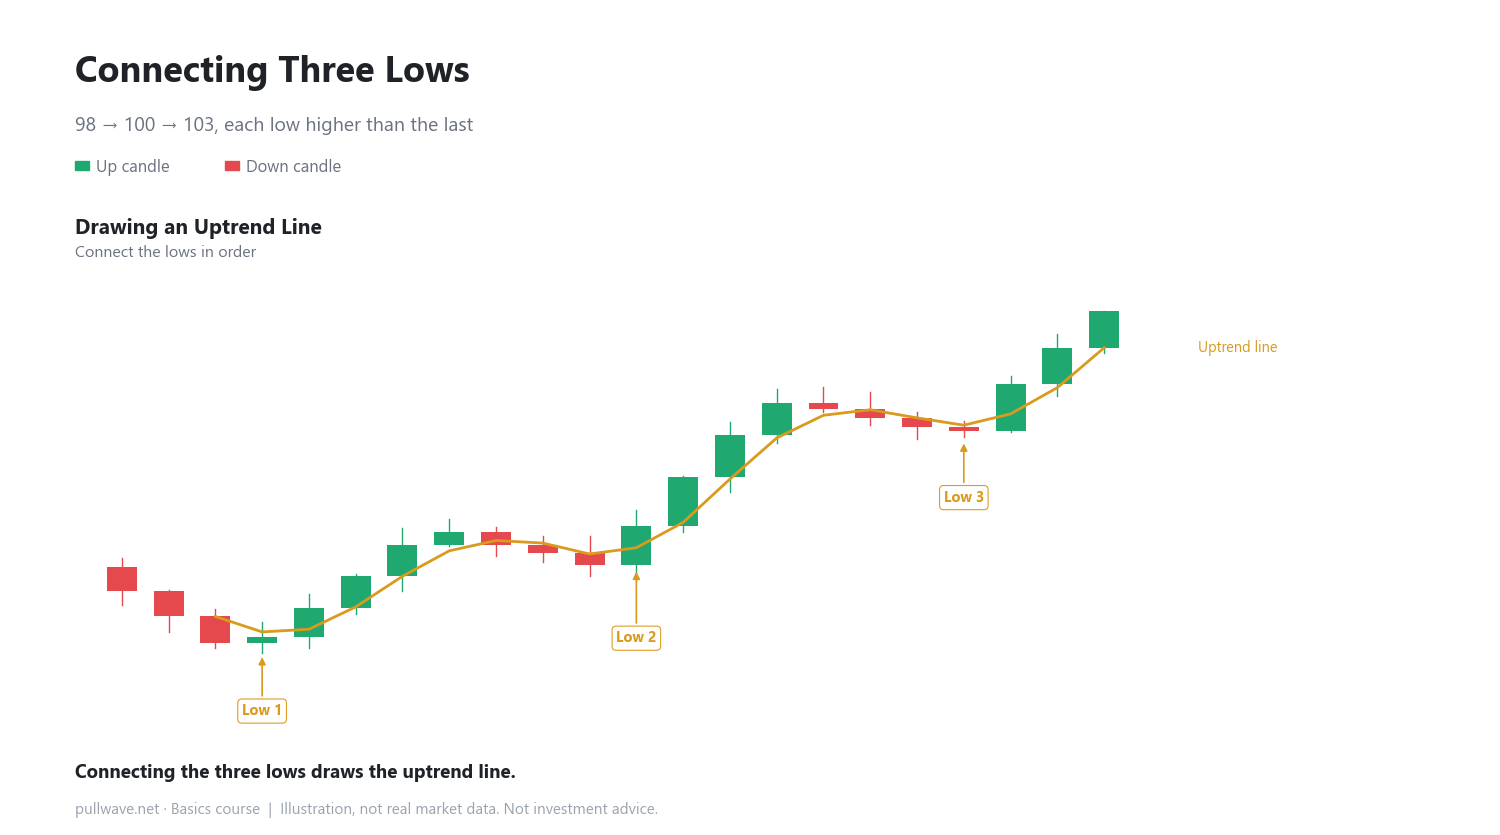
When price is generally rising, each pullback tends to bottom out a little higher than the last one. Connecting these rising lows in order gives you an uptrend line. For example, if the first low is 98, the second is 100, and the third is 103, the line connecting them slopes up and to the right.
Downtrend line: connect the highs
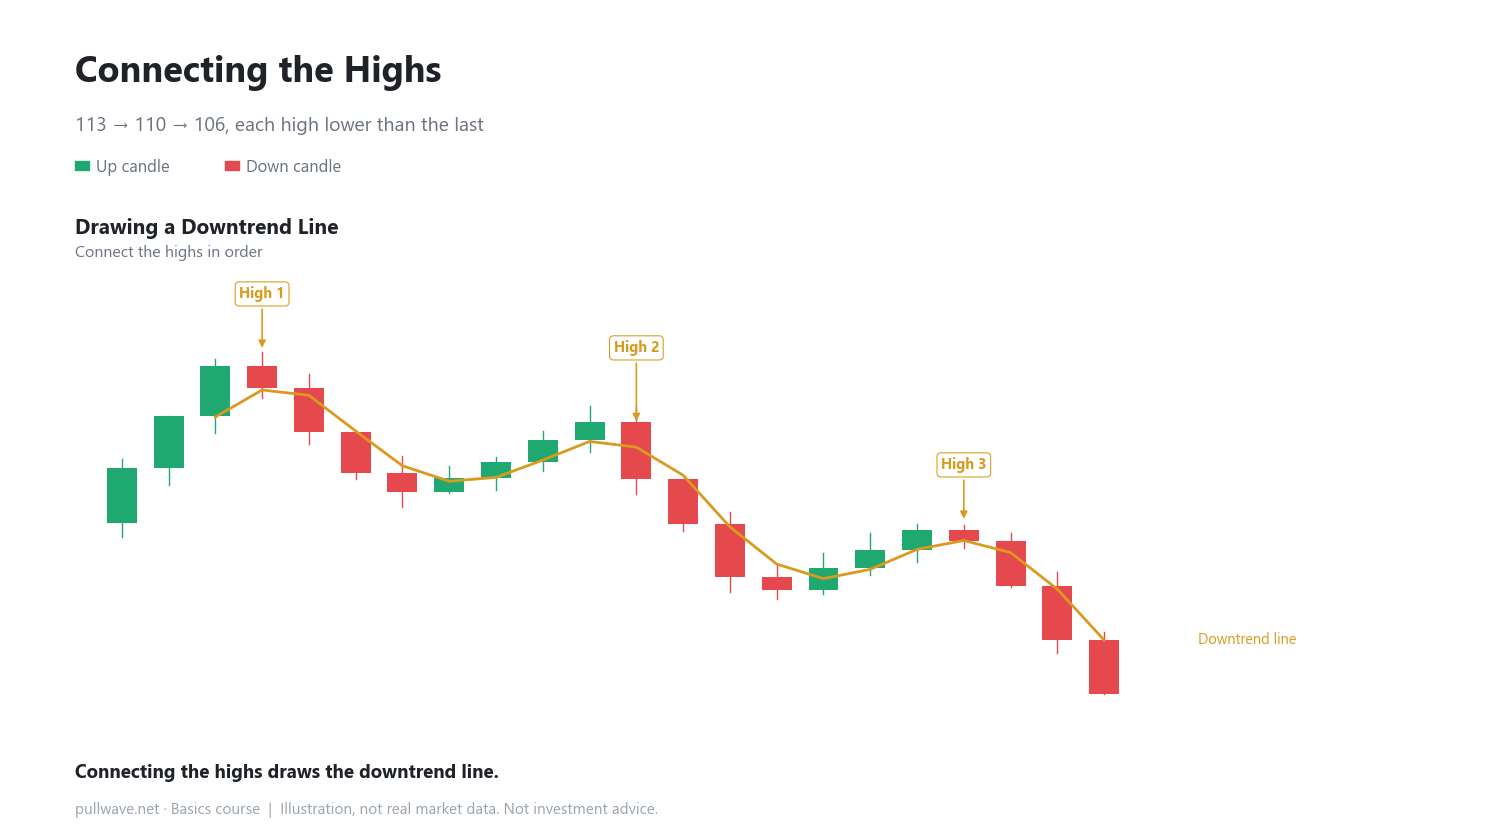
When price is generally falling, each bounce tends to top out a little lower than the last one. Connecting these falling highs gives you a downtrend line. If the highs go 113 → 110 → 106, the line connecting them slopes down and to the right.
Why the third touch matters more
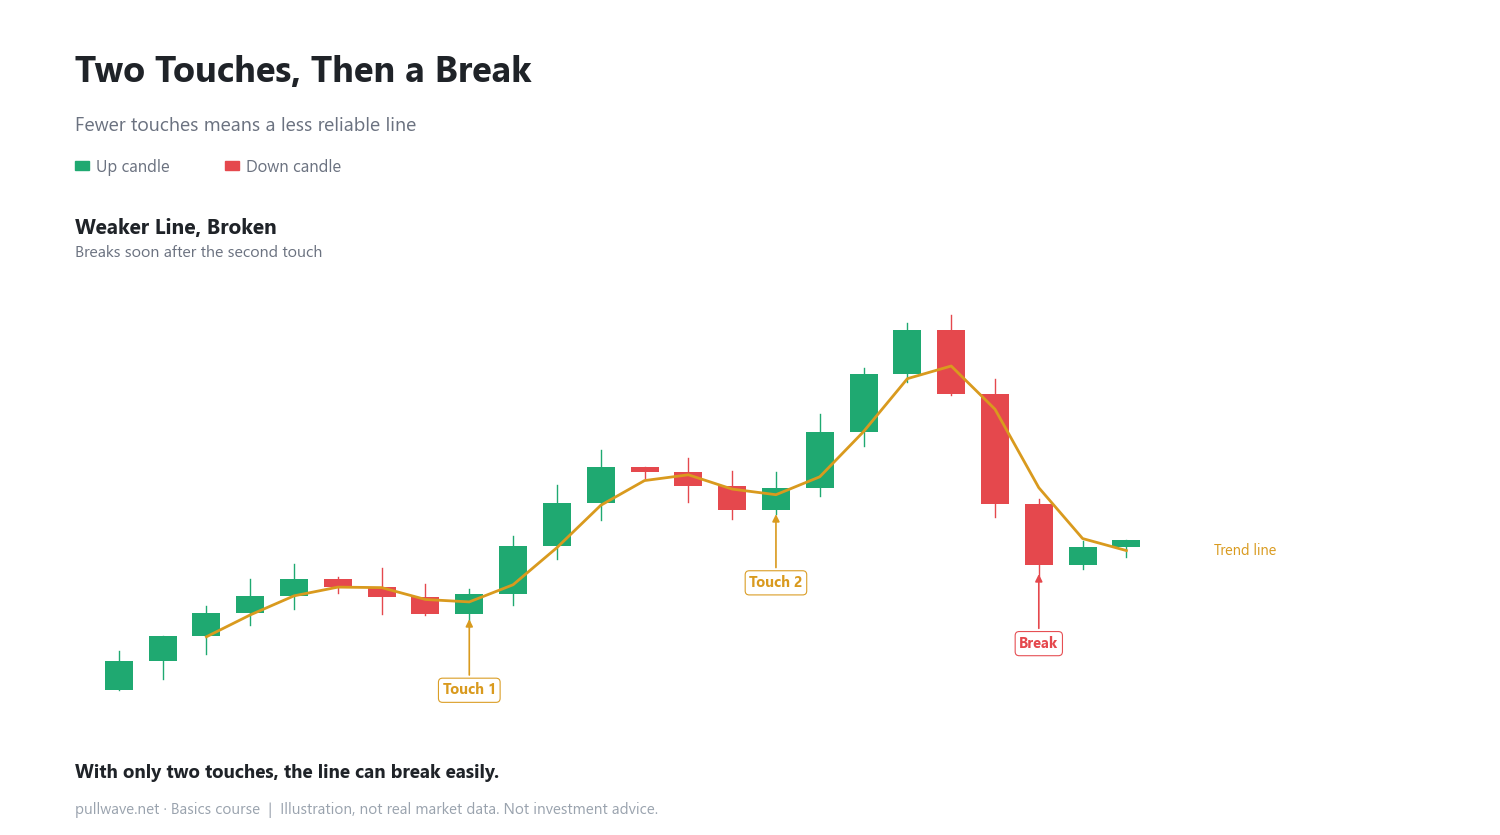
With only two points, you can always draw a straight line between them — that's just geometry, not necessarily meaning. With only two lows or two highs, it's hard to tell whether the line reflects something many traders are watching, or whether it's just a coincidence. When price comes back a third time and reacts near the same line, that's a stronger sign that the level matters to more market participants. That's why traders often say reliability tends to increase with each additional touch.
Why steep lines break easily
When price rises very fast over a short time, the trendline connecting its lows gets steep. The problem is that such a fast pace is hard to sustain for long. Even a small pullback can be enough to break a steep line. A gentler line, by contrast, can usually absorb a similar-sized pullback without breaking. So when a steep trendline breaks, it's worth treating that break with a bit more caution than a break of a gentler line.
How to use it on a real chart
Open a chart, and if price has generally been rising, look for two or three clear lows and connect them with a straight line. If price has been falling, do the same with the highs. Treat this line as something you keep redrawing, not a fixed wall. Every time a new swing low or high forms, update the line so it reflects the current structure rather than an old one.
Common misconceptions
- It's easy to assume price always reverses every time it touches a trendline, but a trendline is only a reference based on past movement — it's not a wall that stops price.
- Some assume a single break of a trendline means the trend is completely over, but a break can also be a temporary pullback, so it helps to confirm with other evidence before drawing conclusions.
FAQ
How many points do I need to draw a trendline?
Technically, two points are enough to draw a straight line. But as explained above, two points alone don't tell you much about reliability, so many traders wait for a third touch before treating the line as meaningful.
Does a broken trendline mean the direction has flipped?
Not necessarily. A break only shows that the previous move may be losing strength — it doesn't by itself tell you which direction comes next. Combining it with other price structure or volume clues gives a clearer picture.
General education, not investment advice. The picture is an illustration, not real market data.