Basics course · Lesson 19 · Part 3 · Trend and price structure
Support and Resistance: Zones, Not Single Lines
At a glance
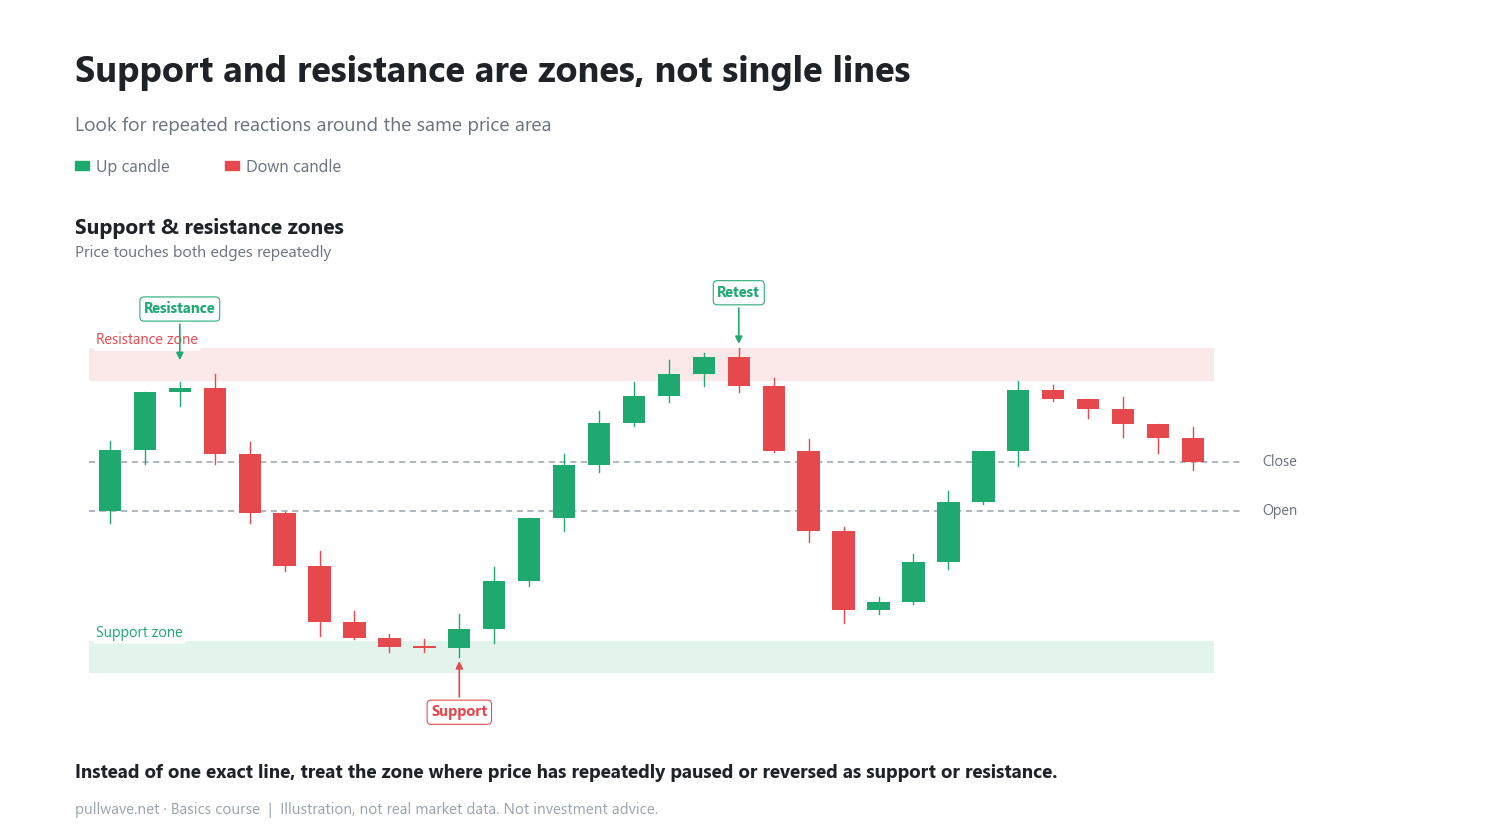
- Support is a zone where price has repeatedly been propped up.
- Resistance is a zone where price has repeatedly been turned back.
- Treating them as a zone with width fits real price action better than a single line.
In the previous lesson we saw downtrends where highs and lows step down together. Within that kind of move, there are specific price areas where price keeps pausing or reversing more than once. Today we'll look closely at those areas: support and resistance.
Support is a price area where price has stopped falling and bounced back multiple times. Resistance is the opposite: a price area where price has stopped rising and turned back multiple times. In both cases, the key word is "multiple" — a single touch is not enough to call something support or resistance. A one-off bounce could just be noise.
What support and resistance really are
Support: where price gets propped up
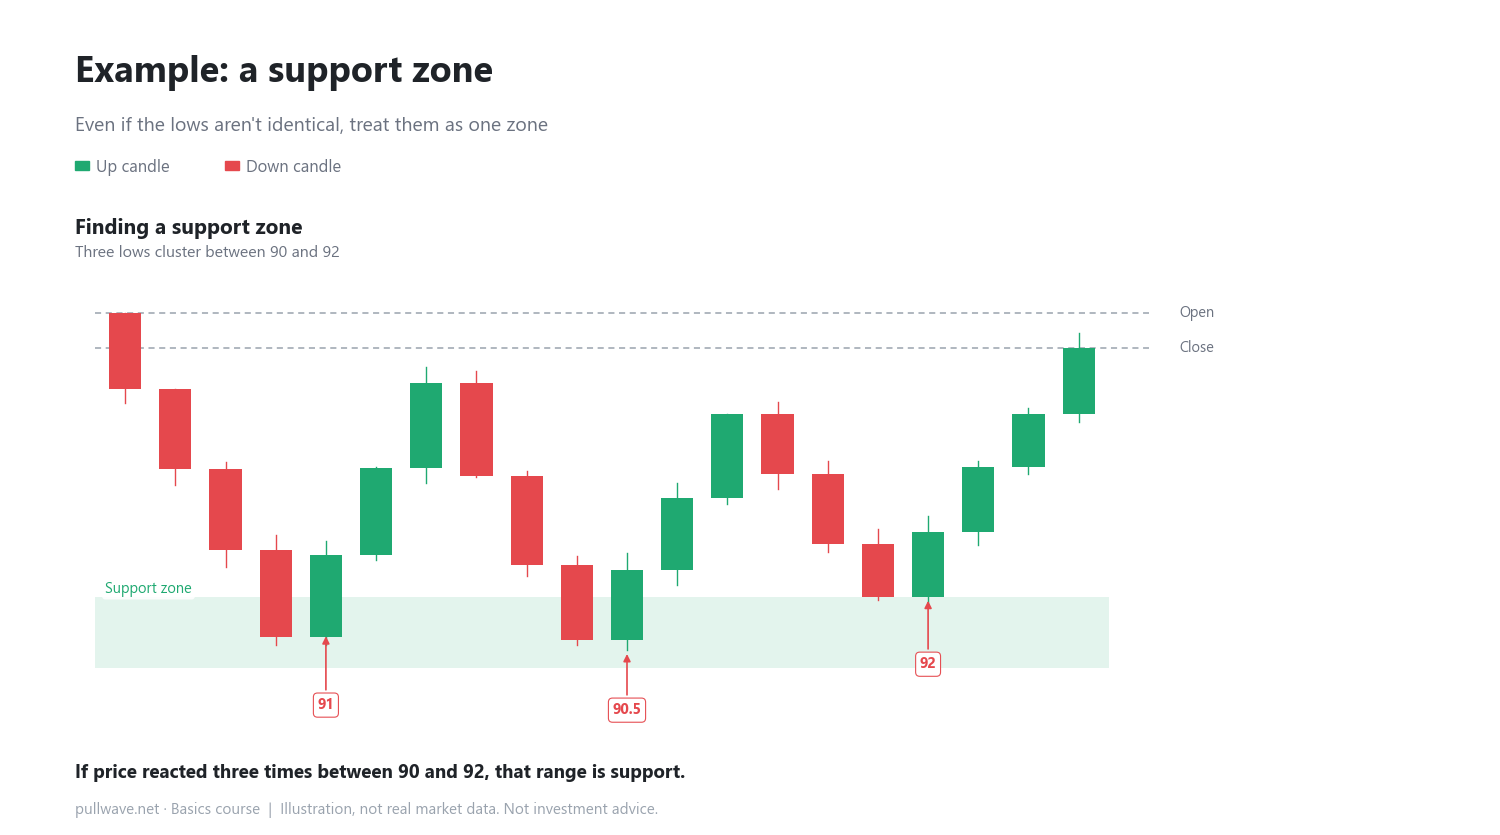
Suppose price paused near 92, then 90.5, then 91 — three separate times — bouncing back up each time. We'd call 90–92 a support zone. Notice it didn't touch exactly 90.0 every time; it reacted somewhere within a similar range.
Resistance: where price gets turned back
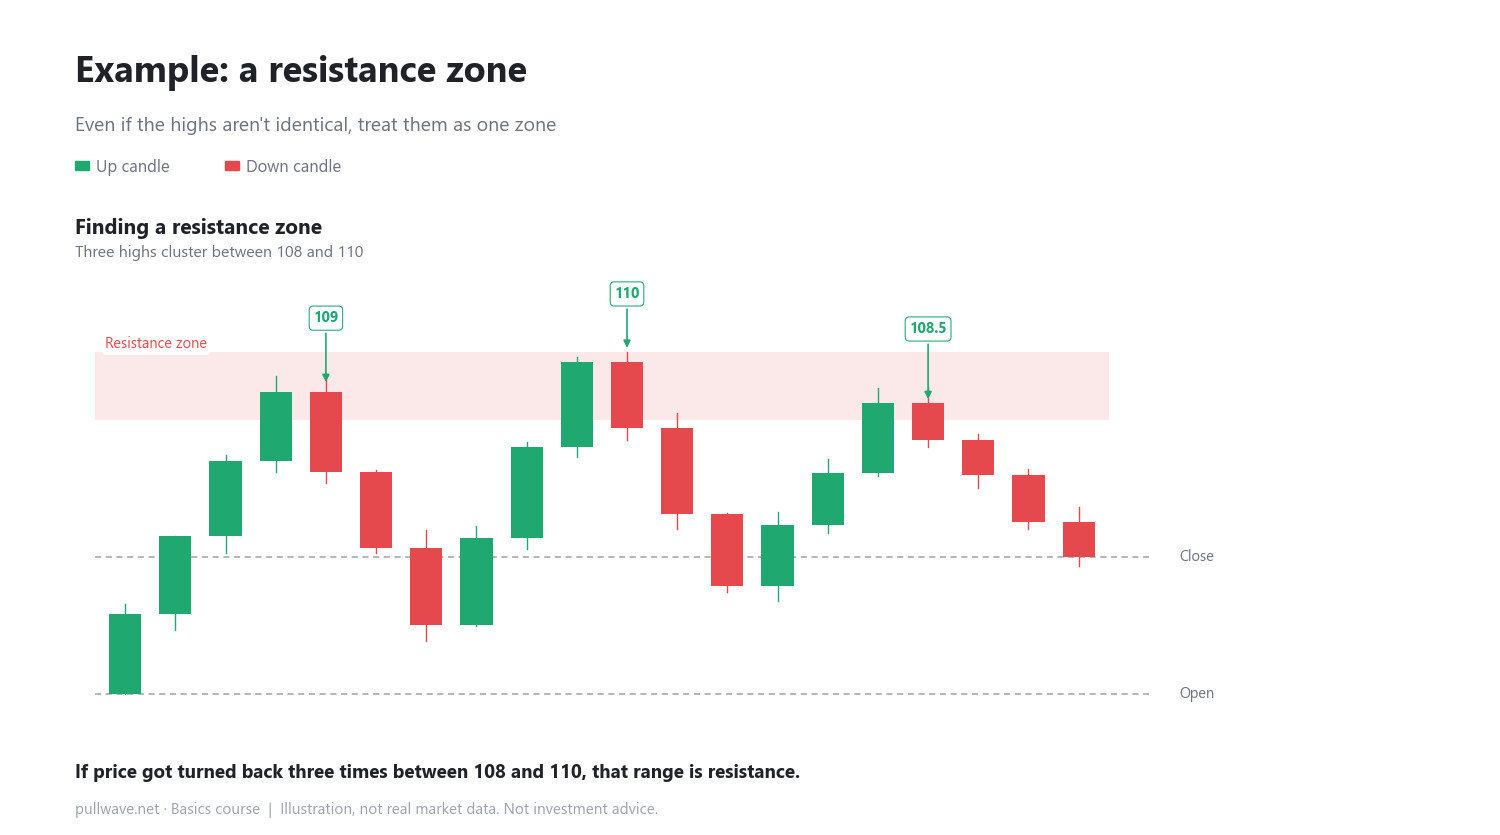
On the other side, if price rose and stalled near 108, then 110, then 109 three times before falling back, 108–110 becomes a resistance zone — a record of repeated attempts that couldn't break through.
Why think in terms of a "zone" instead of a single line
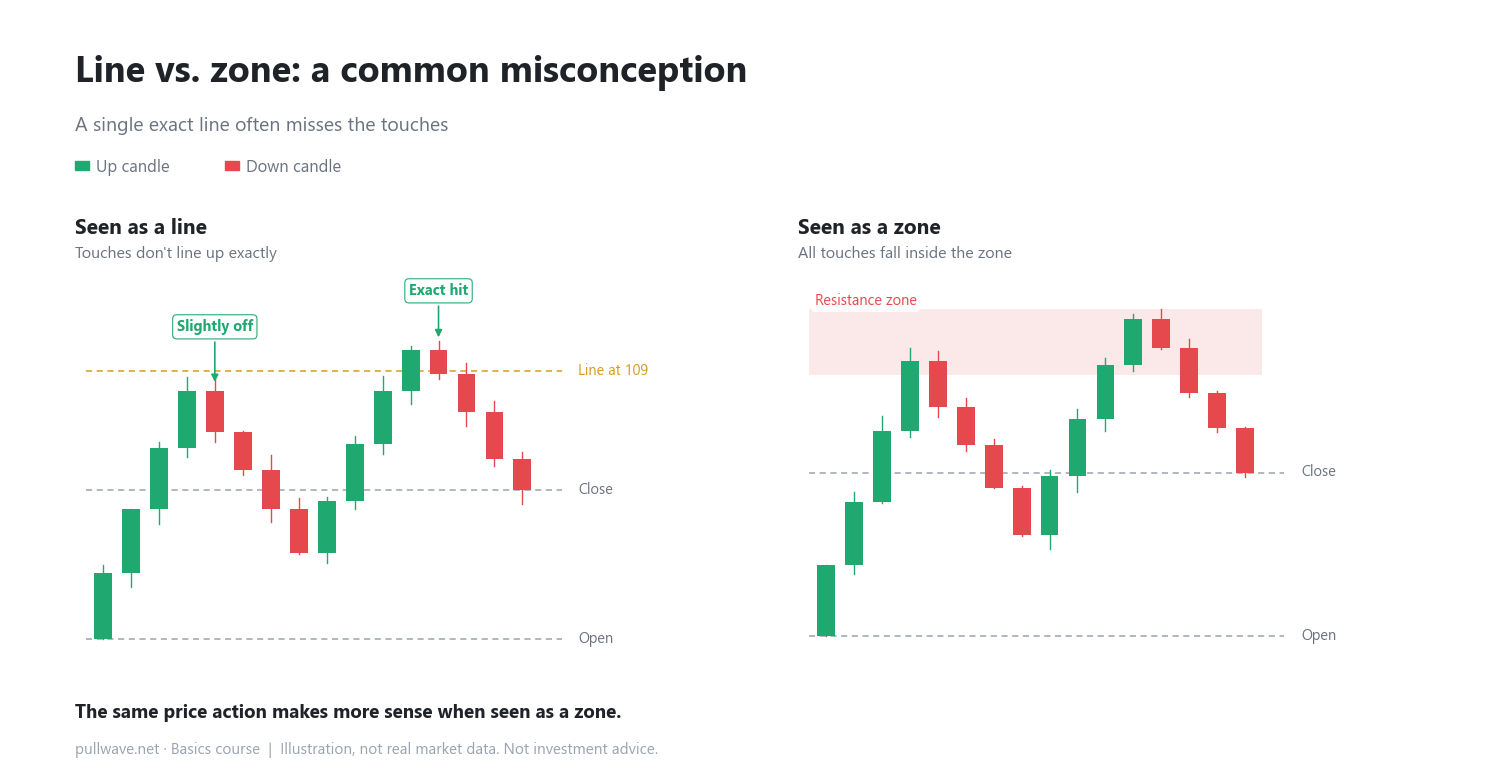
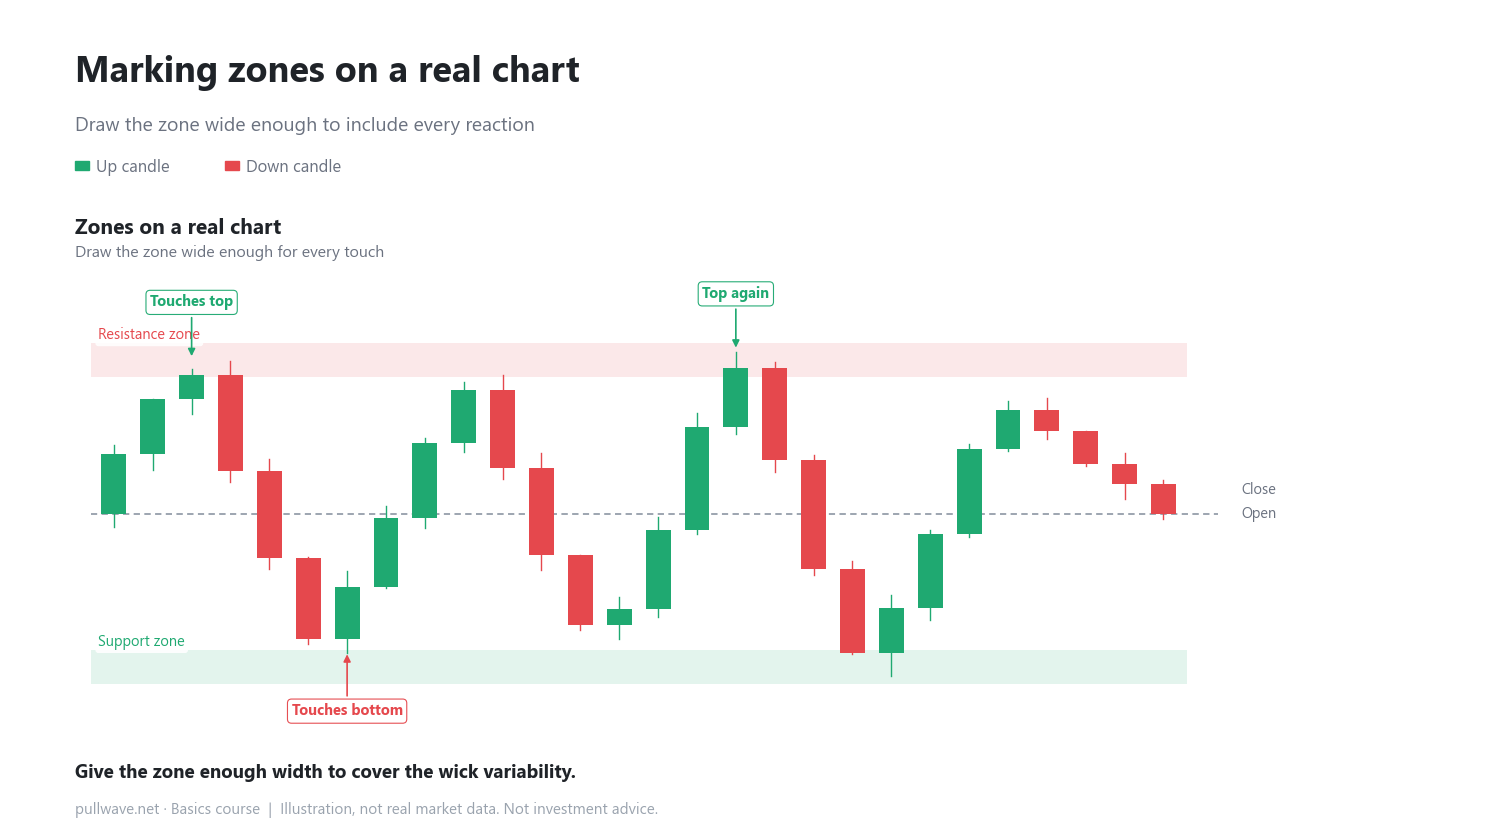
Many beginners hear the words "support line" or "resistance line" and want to draw one exact price. But in real markets, price almost never touches the same number twice. Wick length and daily volatility shift each touch slightly from the last. That's why it makes more sense to think of a zone — a cluster of reactions — rather than one precise line.
How to use it on a real chart
When you look at a chart, find several past points where price paused or reversed, then mark the range that contains all of them as a zone. The more touches you can find, and the tighter they cluster together, the more reliable the zone tends to look. If you only see one or two touches, or the range is very wide, treat that zone with more caution and keep watching how price behaves around it.
Common misconceptions
- Because we call them "lines," it's easy to assume support and resistance sit at one exact price. In practice, treating them as a zone with some width fits real price action much better.
- A single touch doesn't automatically create support or resistance. It usually takes several reactions clustering together before a zone becomes meaningful enough to pay attention to.
FAQ
How wide should a zone be?
There's no fixed formula. Traders usually gather past highs or lows that reacted around the same area and let that range define the zone's width. More volatile assets often call for a somewhat wider zone.
Does a zone disappear once price breaks through it?
Not necessarily. Sometimes one side simply switches roles with the other — a zone that once resisted price can later support it, or the reverse. We'll cover exactly how that works in the next lesson.
General education, not investment advice. The picture is an illustration, not real market data.