Basics course · Lesson 18 · Part 3 · Trend and price structure
Downtrend = Lower Highs and Lower Lows Together
At a glance
- A downtrend forms when highs and lows both step downward together
- Structure holds even after a bounce if the bounce can't clear the prior high
- When a bounce breaks above the prior high, the downtrend structure gets challenged
In the last lesson, we covered uptrends: a structure where both highs and lows step upward together. A downtrend is the mirror image. A high is the highest price reached during a swing, and a low is the lowest price reached during a swing. When each new high is lower than the one before it, and each new low is lower than the one before it, that sequence is what we call a downtrend.
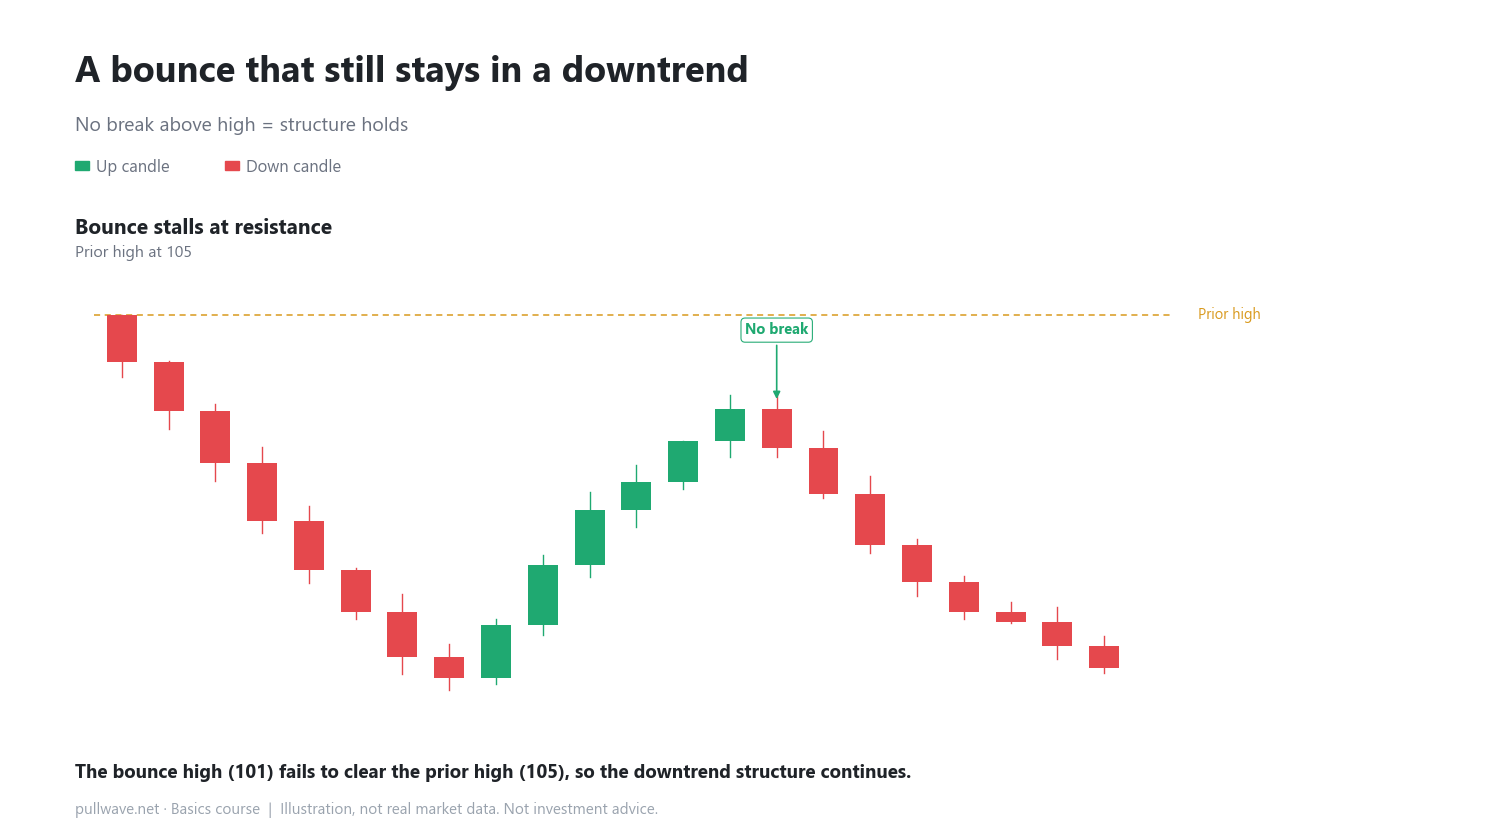
There's one detail that trips up a lot of beginners: even if price bounces up for a while, as long as that bounce fails to climb above the previous high, the downtrend structure is still intact. A bounce by itself is not the same thing as a trend change.
The core idea
Highs and lows step down together
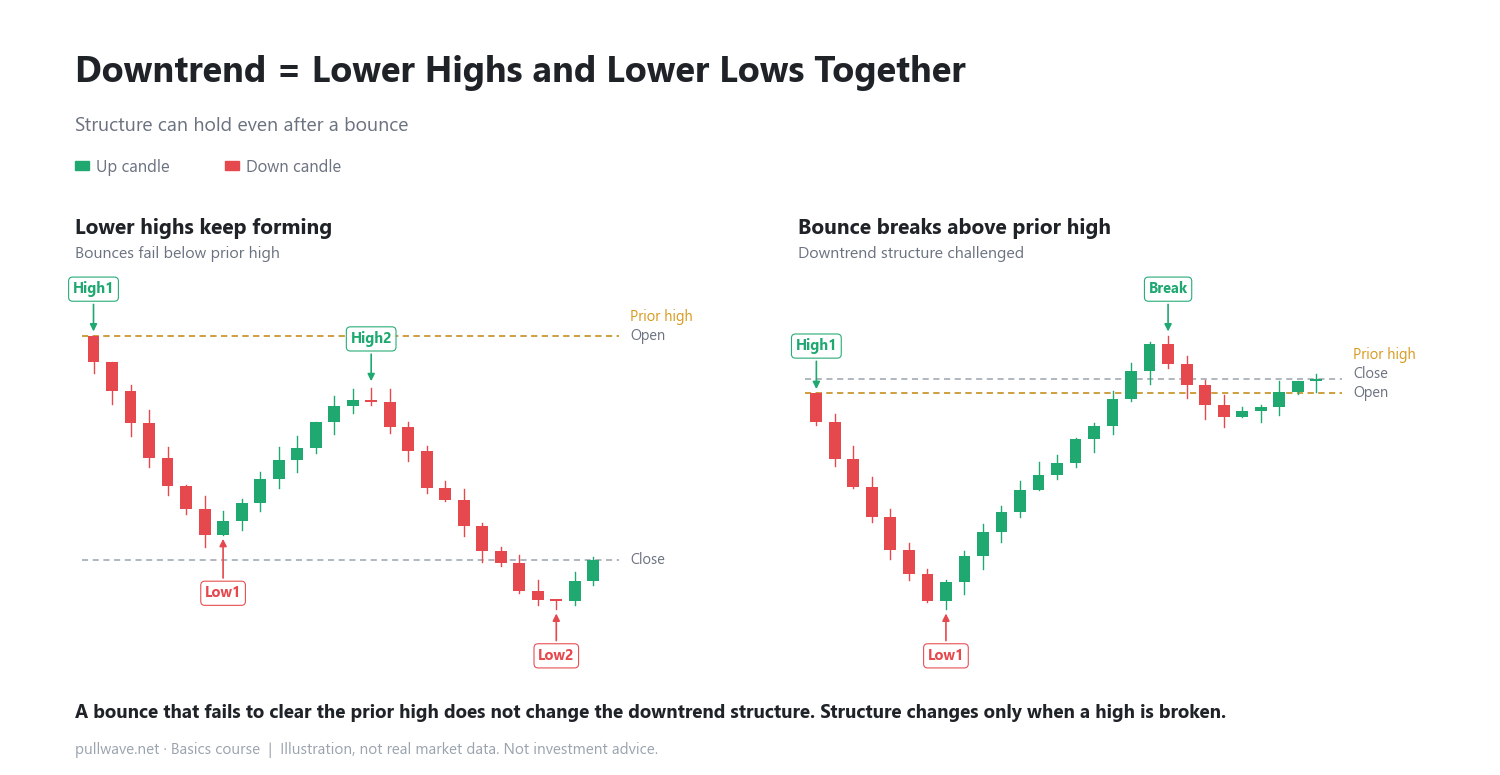
Look at the left panel of the main illustration. The first high is 108 and the first low is 92. Then a bounce lifts price to 104 — but it never reaches 108. That's a lower high. After that, price falls again, this time down to 86, which is below the previous low of 92. That's a lower low. Because both the high and the low moved down (108→104 and 92→86), this stretch qualifies as a textbook downtrend.
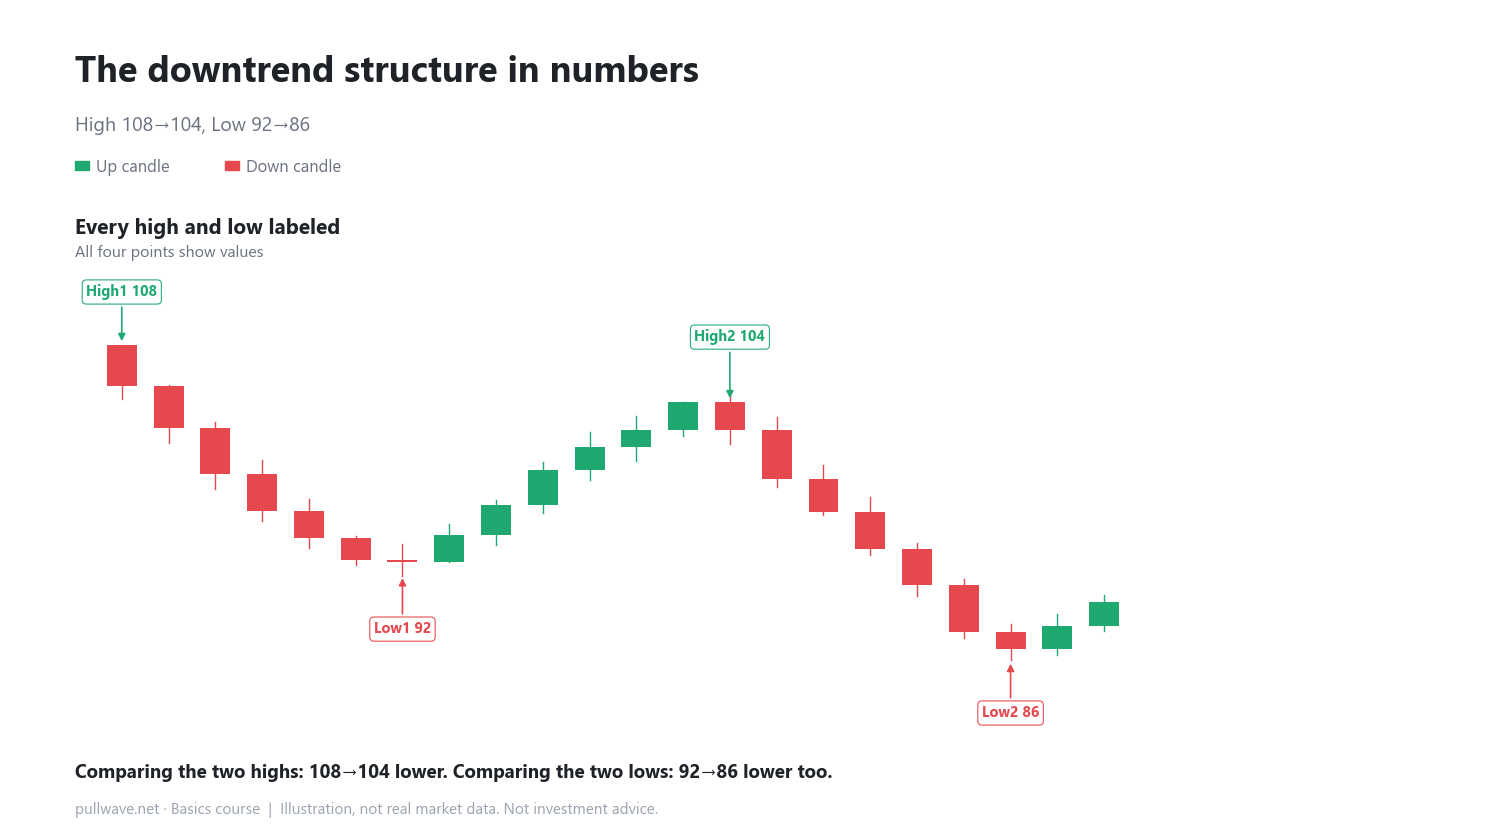
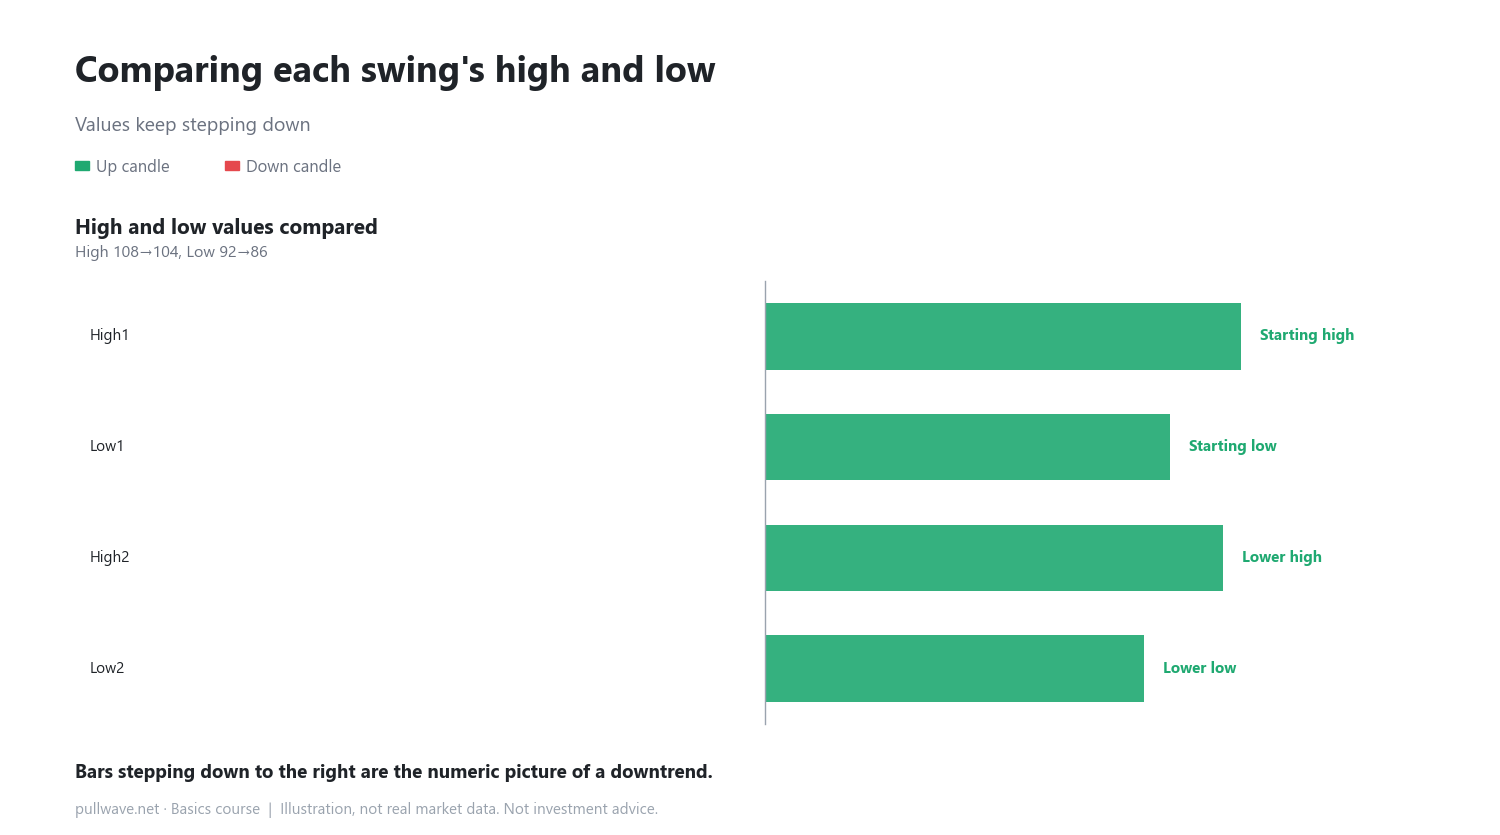
Put into numbers: High 1 (108) to High 2 (104) is a drop of 4 points. Low 1 (92) to Low 2 (86) is a drop of 6 points. What matters is that both numbers move in the same direction — down. If only one of them drops while the other stays flat or rises, you're probably looking at a sideways range rather than a real trend.
What happens when a bounce breaks the previous high
Now look at the right panel. Again, High 1 is 108 and Low 1 is 93. But this time the bounce doesn't stop at 104 — it pushes through 108, reaching 112. That previous high has been broken. Once that happens, the "lower highs" condition no longer holds, so it becomes much harder to call this a downtrend in the same way. One single break doesn't automatically prove an uptrend has started, but it does mean the downtrend structure is being challenged.
How to use it on a real chart
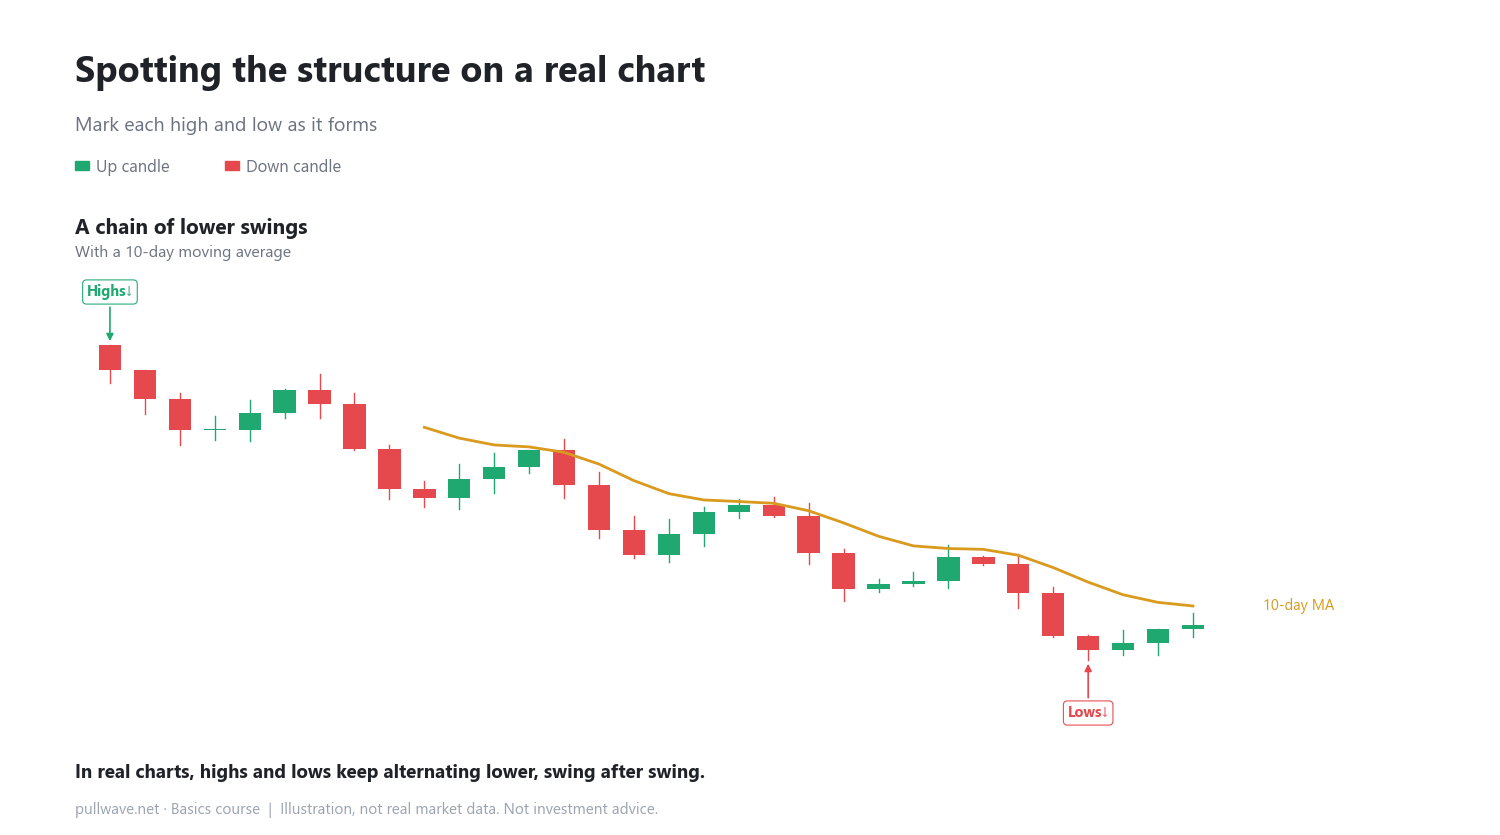
Real charts rarely show just one high and one low — they show a chain of swings, each with its own high-low pair. A simple habit that helps: mark every visible high and ask whether it sits below the previous one. Do the same for lows. You can layer a moving average on top for a smoother visual reference, but the real test is always the highs and lows that price itself leaves behind.
Common misconceptions
- Many traders assume that any bounce means the trend has flipped. In reality, a bounce that fails to clear the previous high changes nothing about the structure.
- Some assume one lower low is enough to call something a downtrend. A full downtrend structure needs the highs to step down too, not just the lows.
FAQ
If the bounce is really big, should I treat it as an uptrend already?
Size doesn't decide it — whether the bounce clears the previous high does. Even a large bounce that stalls below the prior high leaves the downtrend structure intact.
How do I decide what counts as "a high" or "a low" in the first place?
Generally, a high is a point that's clearly above the prices around it, and a low is clearly below the prices around it, within the swing you're looking at. This connects directly to the next lesson on support and resistance.
General education, not investment advice. The picture is an illustration, not real market data.