Basics course · Lesson 16 · Part 3 · Trend and price structure
How to Spot Swing Highs and Swing Lows
At a glance
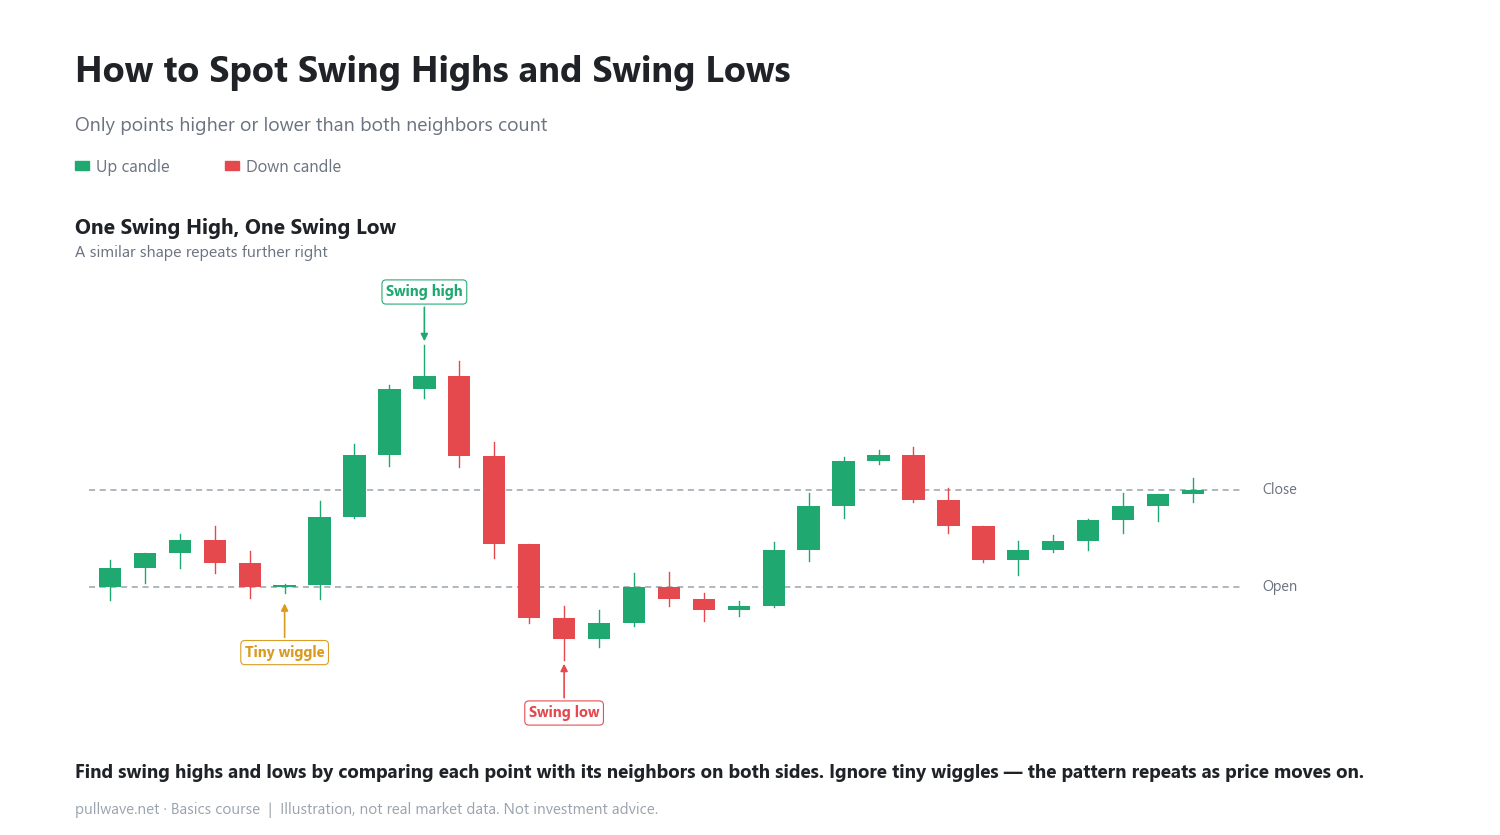
- A swing high is higher than the candles on both sides; a swing low is lower than both sides.
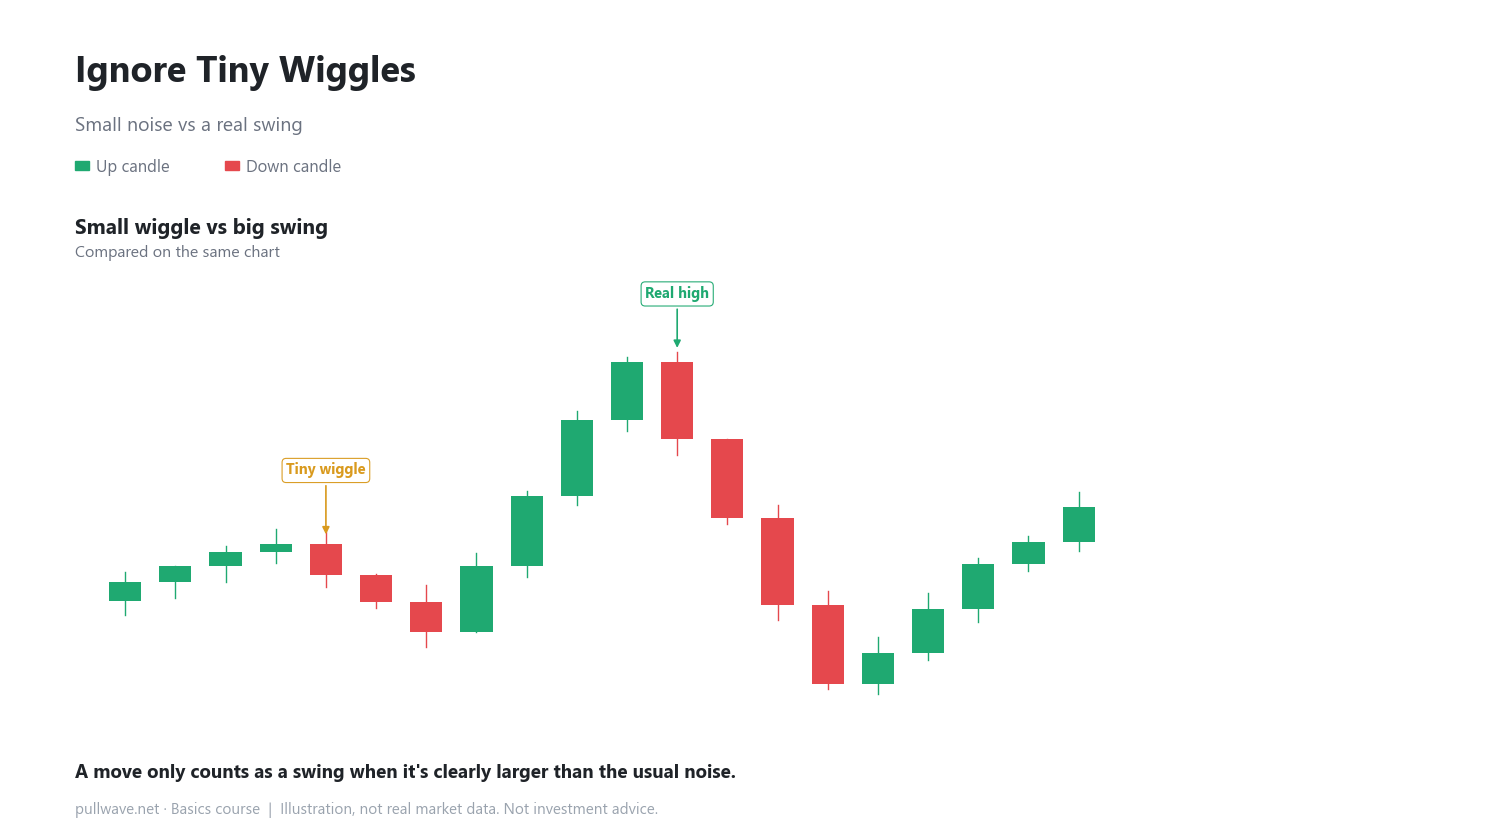
- Tiny wiggles that aren't clearly larger than normal noise don't count as swings.
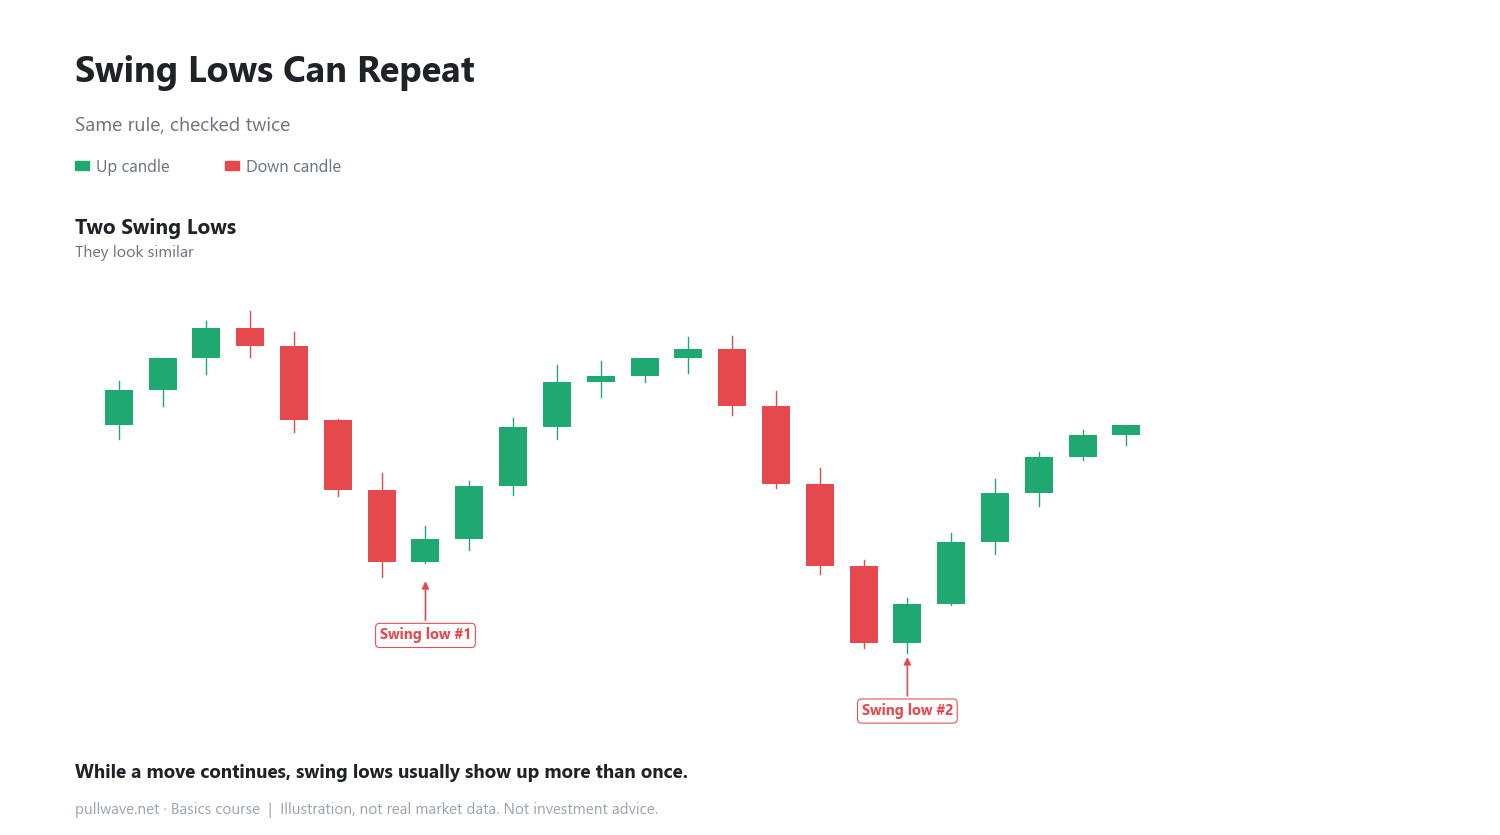
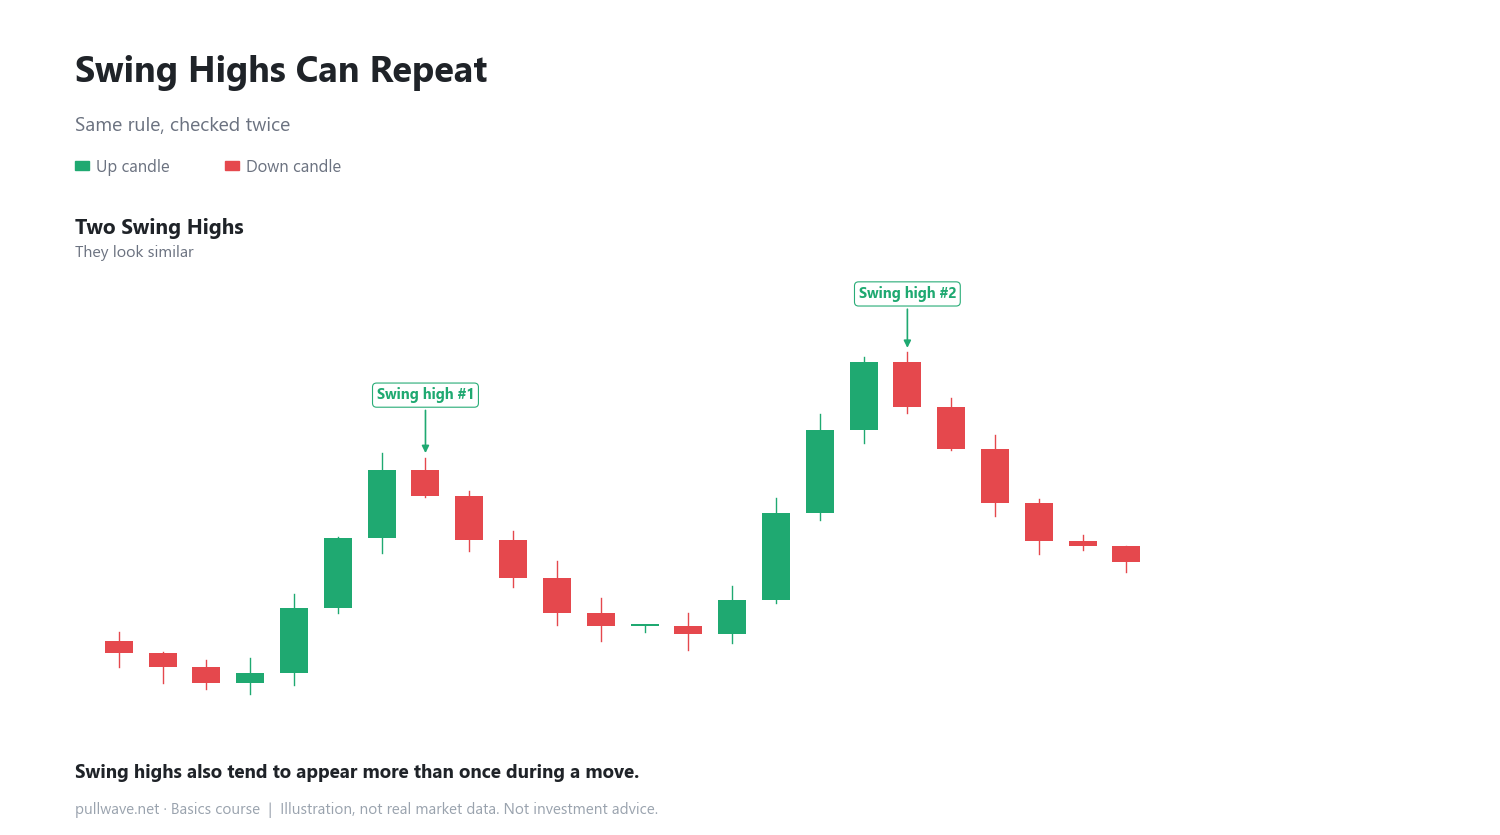
- Swing highs and lows repeat several times while a move continues.
In the previous lesson we looked at why a candle's close matters so much. This time we look at the shape made by many candles together, and specifically at how to spot a "swing high" and a "swing low" inside all that zigzagging. Price almost always moves up and down in small steps, so you need a clear rule for picking out which turning points actually matter.
A swing high is a point whose high is above the highs of the candles on both sides of it — higher than the candle to its left and higher than the candle to its right. A swing low is the opposite: a point whose low is below the lows on both sides.
The core idea: compare with both neighbors
Finding a swing high
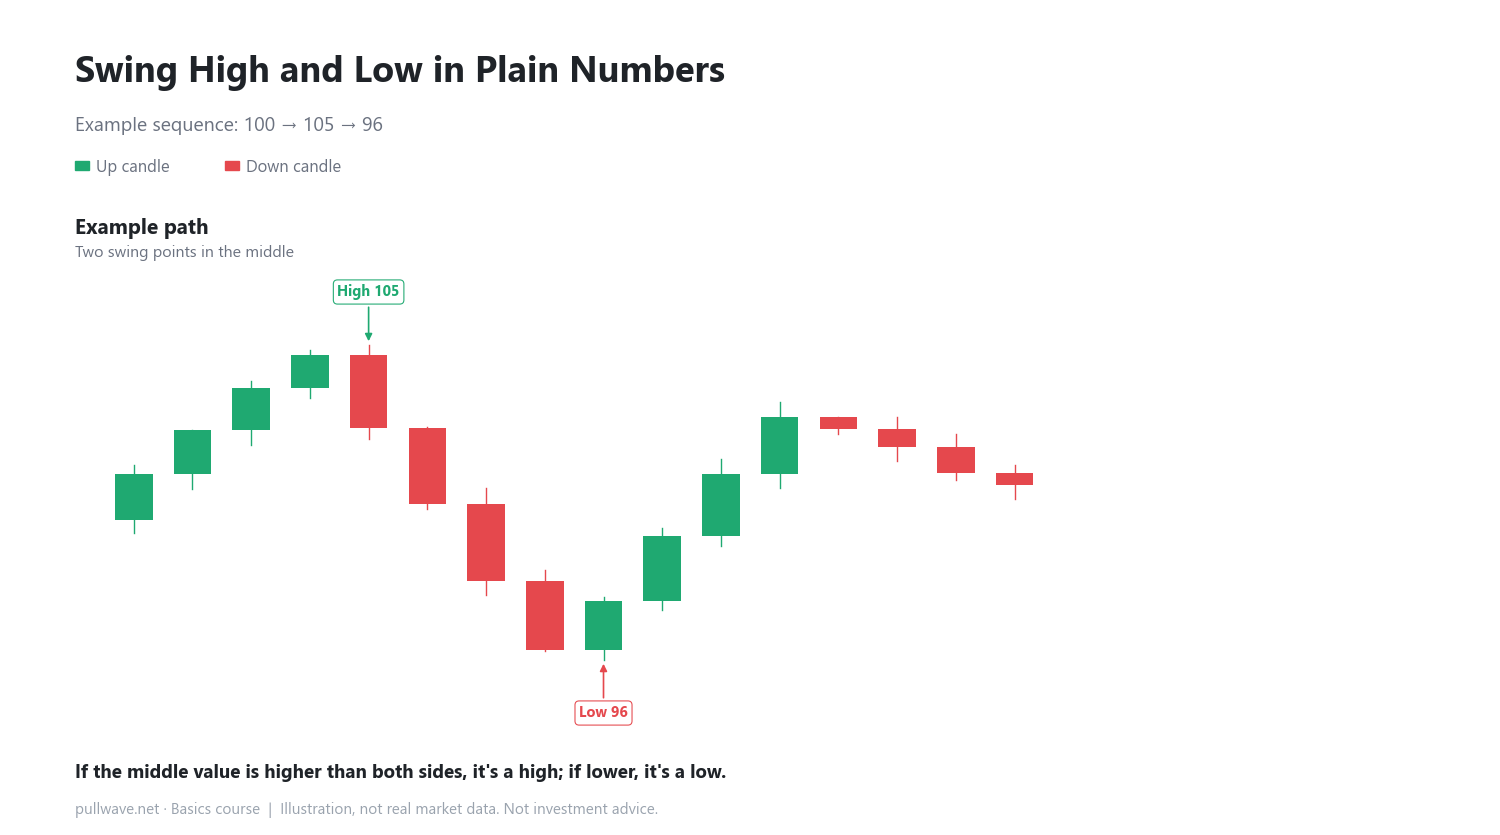
Let's use simple numbers. Say price moves 100 → 105 → 96, in that order (these are illustration numbers, not a forecast). The middle value, 105, is higher than 100 on the left and higher than 96 on the right. That makes 105 a swing high.
Finding a swing low
The same logic works for lows. If the sequence continues 105 → 96 → 103, then 96 is lower than 105 on the left and lower than 103 on the right, so 96 is a swing low. In the main illustration, a swing high appears after the first rally, and a swing low appears after the drop that follows. A similar high and low show up again further to the right — try spotting them yourself using the same rule.
Ignoring tiny wiggles
Here's the catch: a real chart is full of tiny wiggles that are not meaningful swing points. If you label every small up-and-down as a swing, you end up with so many points that the structure becomes impossible to read. A common approach is to only count a move as a swing when it is clearly larger than the normal back-and-forth noise around it.
Swing highs and swing lows don't just appear once each. While a move continues, they tend to repeat several times. Look first at how lows can repeat.
The same idea applies to highs as well.
How to use it on a real chart
On a real chart, traders often check whether a candle's high is higher than the highs of a handful of candles on each side — for example, two or three candles. There's no single fixed number; the right distance depends on the timeframe you're looking at and how zoomed-in or zoomed-out your view is. What matters is the comparison principle itself: higher or lower than both neighbors.
Common misconceptions
- Treating every small bump as a swing high or low: counting tiny wiggles makes the overall structure harder, not easier, to read.
- Assuming a swing point is fixed forever: once a new candle forms a higher high or a lower low, the earlier point may no longer count as the relevant swing.
FAQ
Do I have to find swing highs and lows by hand?
Early on, it helps to practice comparing each candle with its neighbors directly on a chart. Later you can use tools to help, but you still need to understand the underlying rule — higher or lower than both sides — to interpret the results correctly.
How do I decide if a wiggle is too small to count?
There's no fixed answer. Compare the size of the move with the normal back-and-forth movement on that timeframe. If it's clearly larger, treat it as a meaningful swing; if it's similar or smaller, it's probably just noise.
General education, not investment advice. The picture is an illustration, not real market data.