Basics course · Lesson 20 · Part 3 · Trend and price structure
The Moment Resistance Flips to Support: Success and Failure
At a glance
- A broken resistance can flip into support if the pullback holds above it
- If price breaks back below on the pullback, the flip has failed
- It's often more useful to think of resistance as a zone, not one exact price
In the last lesson, you learned what support and resistance are, and why price often reacts at those levels. This lesson goes one step further: we'll look at how a broken resistance level can later act as support — and why that flip doesn't always work.
Let's define the terms first. Resistance is a price area where price has repeatedly paused or turned back while rising. A breakout happens when price pushes through that resistance. A pullback is the move back toward that area after the breakout, and a retest is when price checks that level again. A polarity flip is when an old resistance level starts acting as support after being broken.
What separates success from failure
Success: it holds on the retest
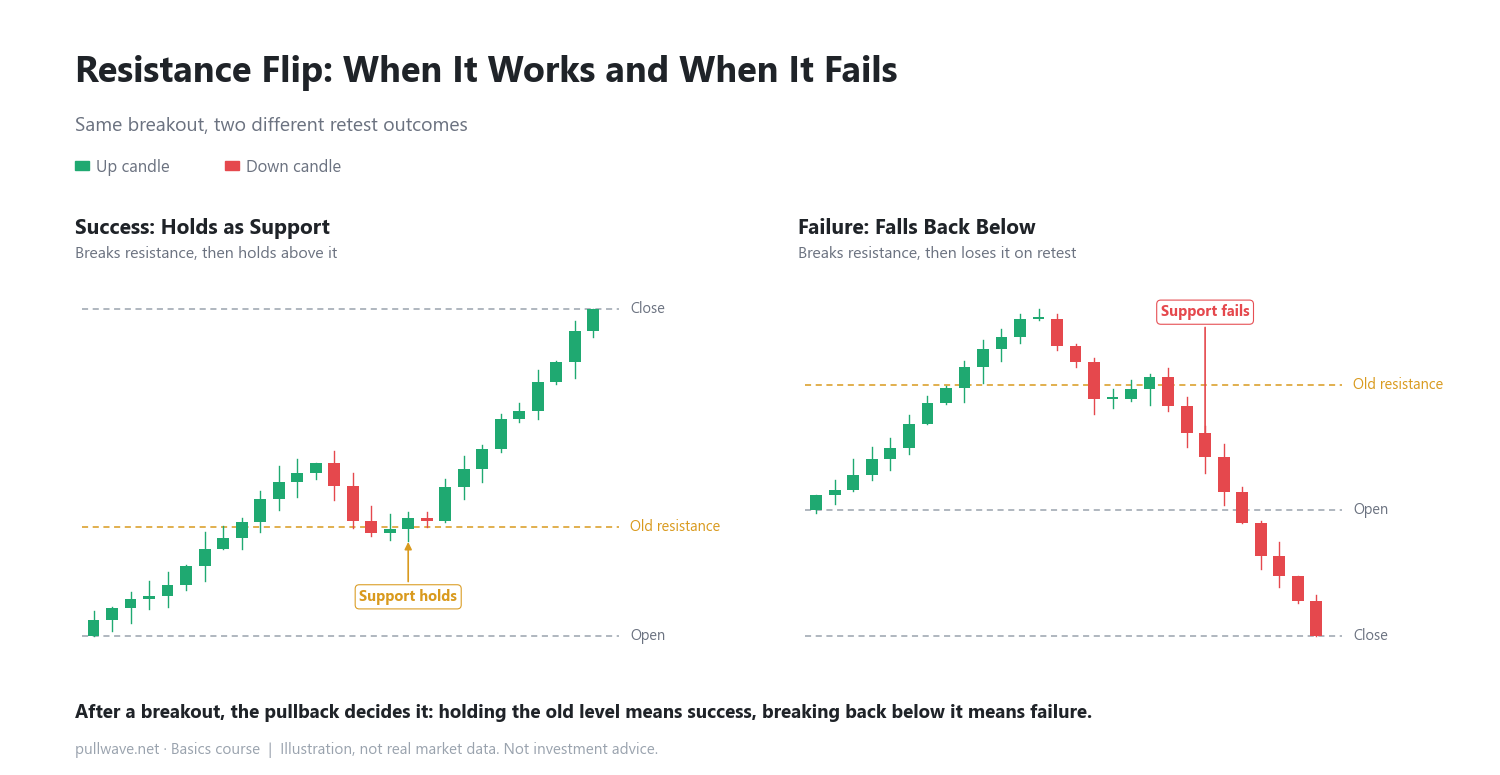
In the left panel of the illustration, price breaks through resistance near 100 and climbs to 103, then pulls back down to around 99.5. Instead of collapsing below the old resistance at 100, price holds above it and turns back up. When a pullback stops above the old resistance, that level can be read as having flipped into support.
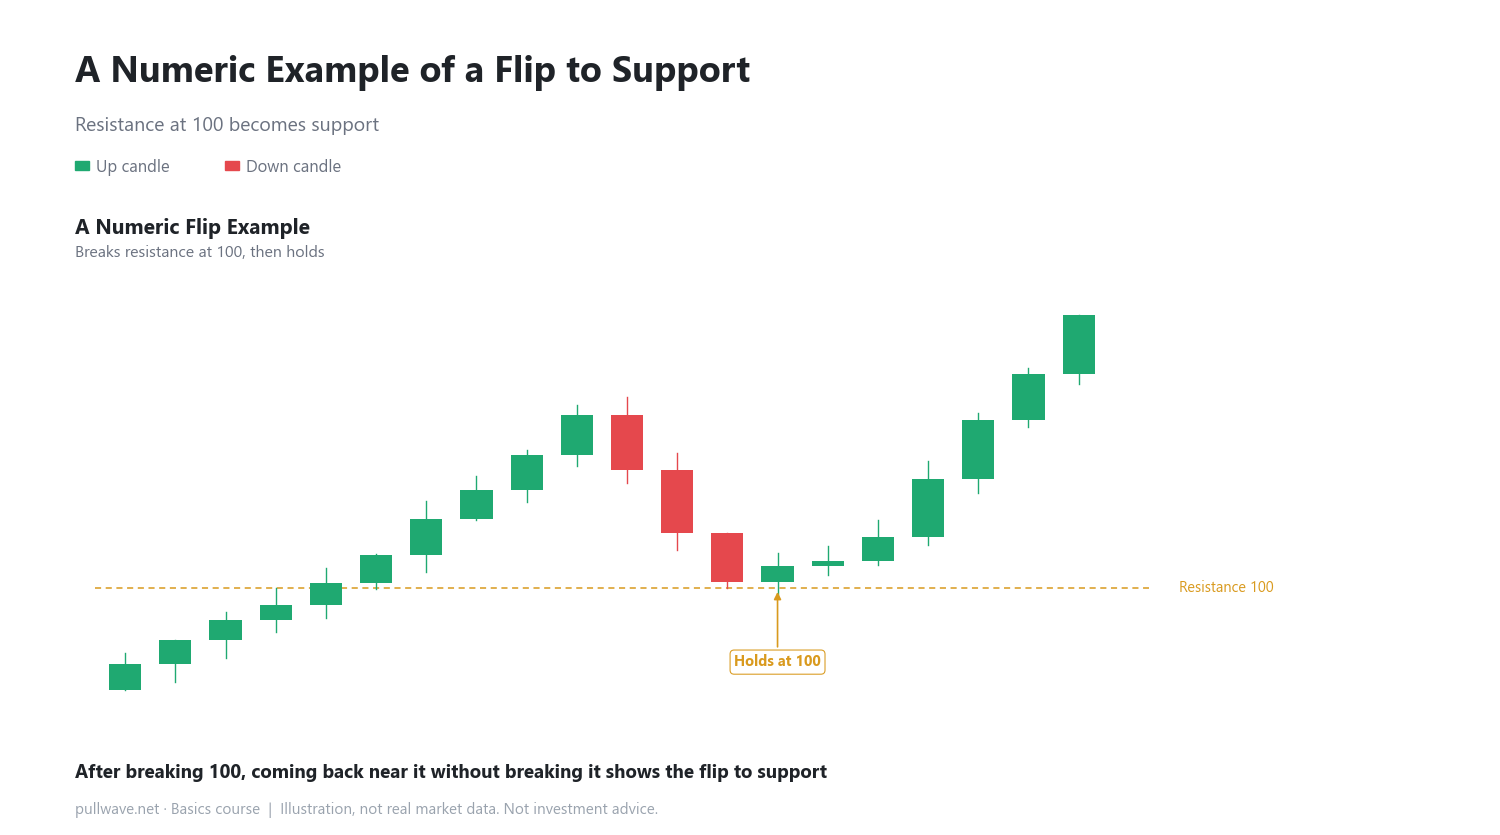
Let's put numbers on it. Suppose resistance sat at 100 and price broke out to 105. On the pullback, price comes back down to 100 but doesn't break it, then rises again to 101.5. That pattern suggests 100 is now acting as support.
Failure: it breaks down on the retest
The right panel shows a different outcome. Price breaks the same level at 100, rises to 103 — but on the pullback, it breaks back below 100, falling to 97 and then 90. Here, the breakout didn't hold up, and the old resistance never became support.
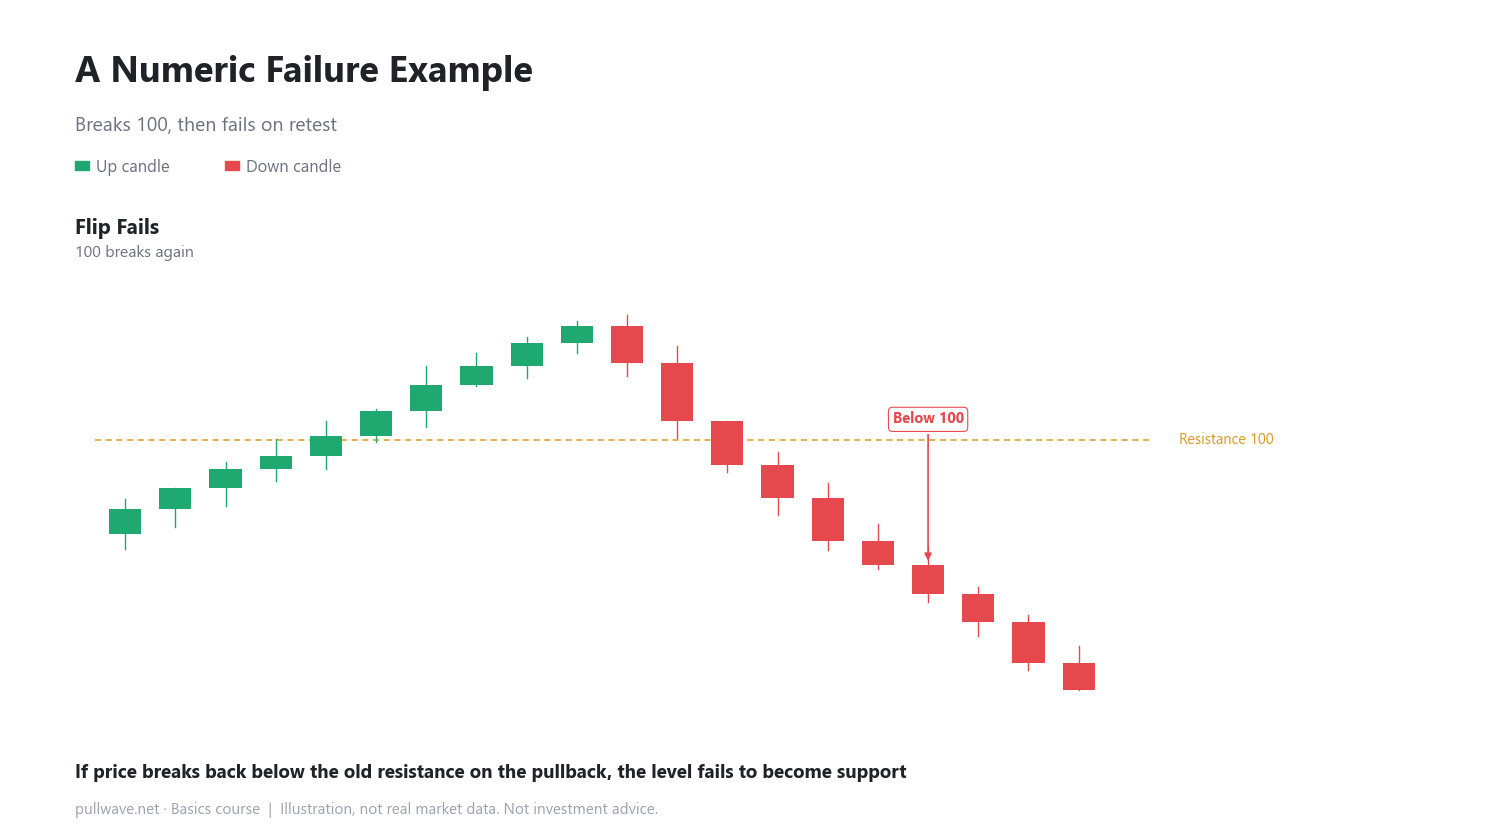
In numbers: resistance at 100 breaks out to 104, pulls back to 99, then continues down to 96. In this case, 100 has failed to act as support.
Resistance isn't always one exact line
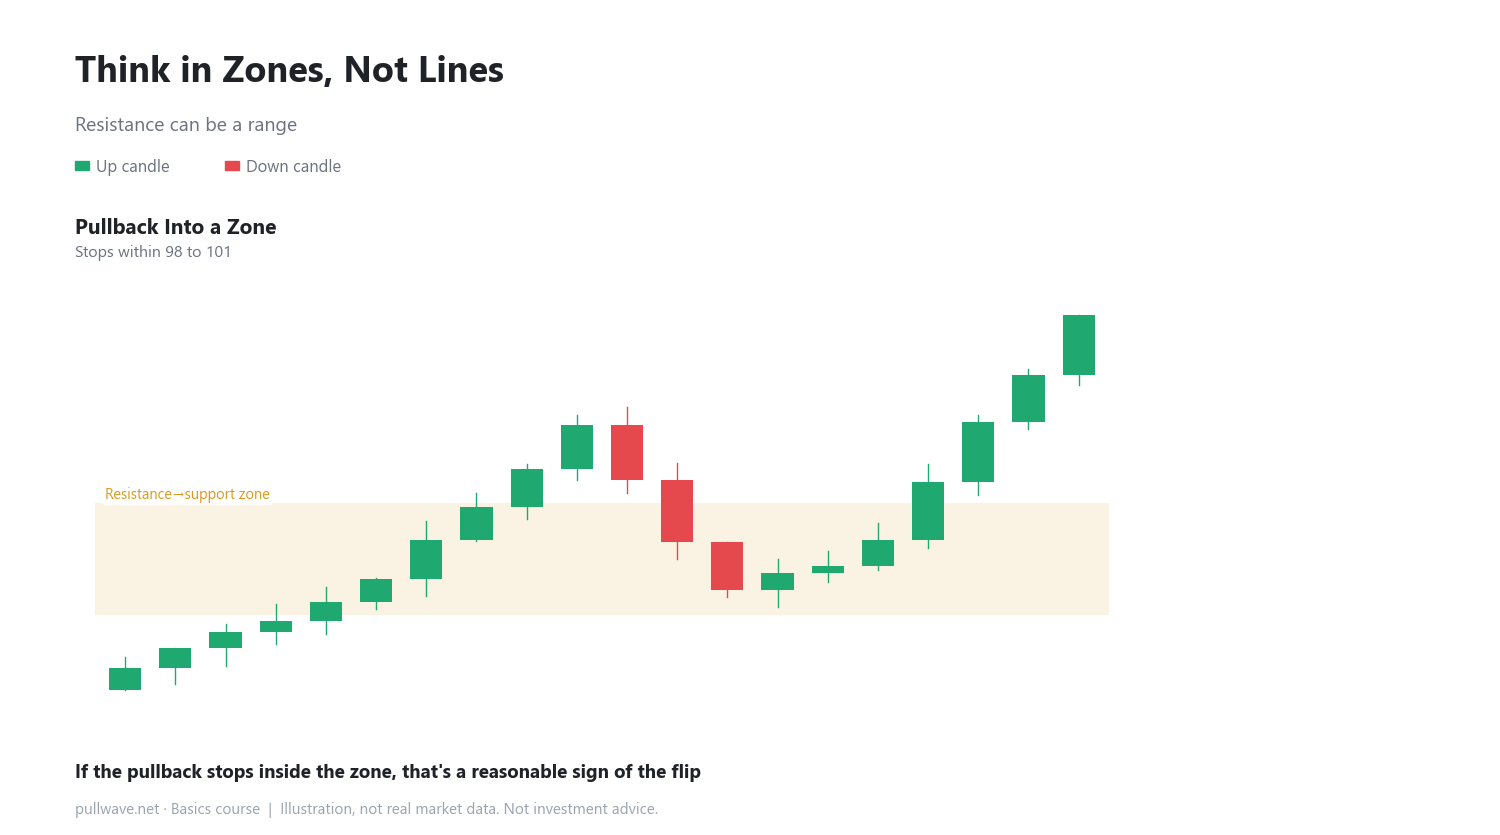
On a real chart, resistance often shows up as a range — say, 98 to 101 — rather than one precise number like 100.00. If the pullback stops somewhere inside that range, it's reasonable to treat it as a flip to support. Fixating on one exact price can make this harder to read than it needs to be.
How to use it on a real chart
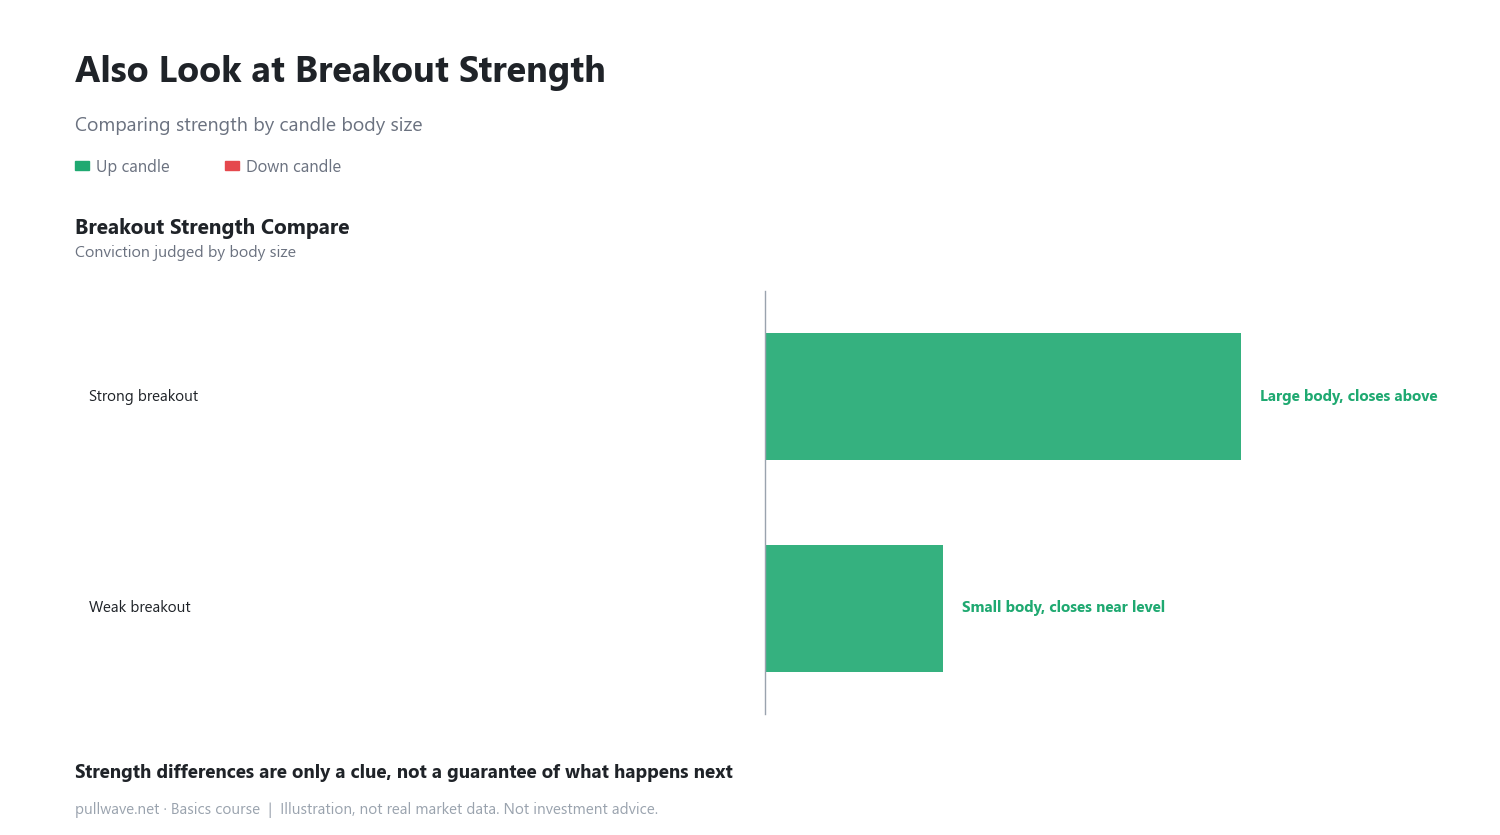
When you look at a real chart, check things in order. First, did a genuine breakout happen, with a candle that has a reasonably large body and closes clearly above the old resistance? A breakout candle with a large body and a clean close above the level can be one small clue — compared to a breakout with a small body closing right at the edge — about whether that area might hold later as support. This is only a clue, not a guarantee of what happens next.
Then watch what happens on the pullback: does price stop within that zone, or does it break straight through? This can take more than one candle to play out, so it helps to watch the flow across several candles rather than judging from a single one.
Common misconceptions
- Some traders assume that once resistance is broken, it automatically becomes support forever. In reality, price often breaks back below that level on the retest.
- Some traders think the retest has to come back to the exact same price to count as a flip. In practice, it's more useful to think in terms of a zone rather than one precise number.
FAQ
How deep does the pullback need to be to count as a flip to support?
There's no fixed number. What matters more than depth is whether price stops within the zone and then turns back up.
Once a flip is confirmed, will that support always hold afterward?
No. Support and resistance are both relative concepts, and levels can break again later depending on market conditions. Confirming a flip once doesn't mean it holds forever.
General education, not investment advice. The picture is an illustration, not real market data.