Basics course · Lesson 21 · Part 3 · Trend and price structure
Anatomy of a Fake Breakout: Wick, Close, and Volume
At a glance
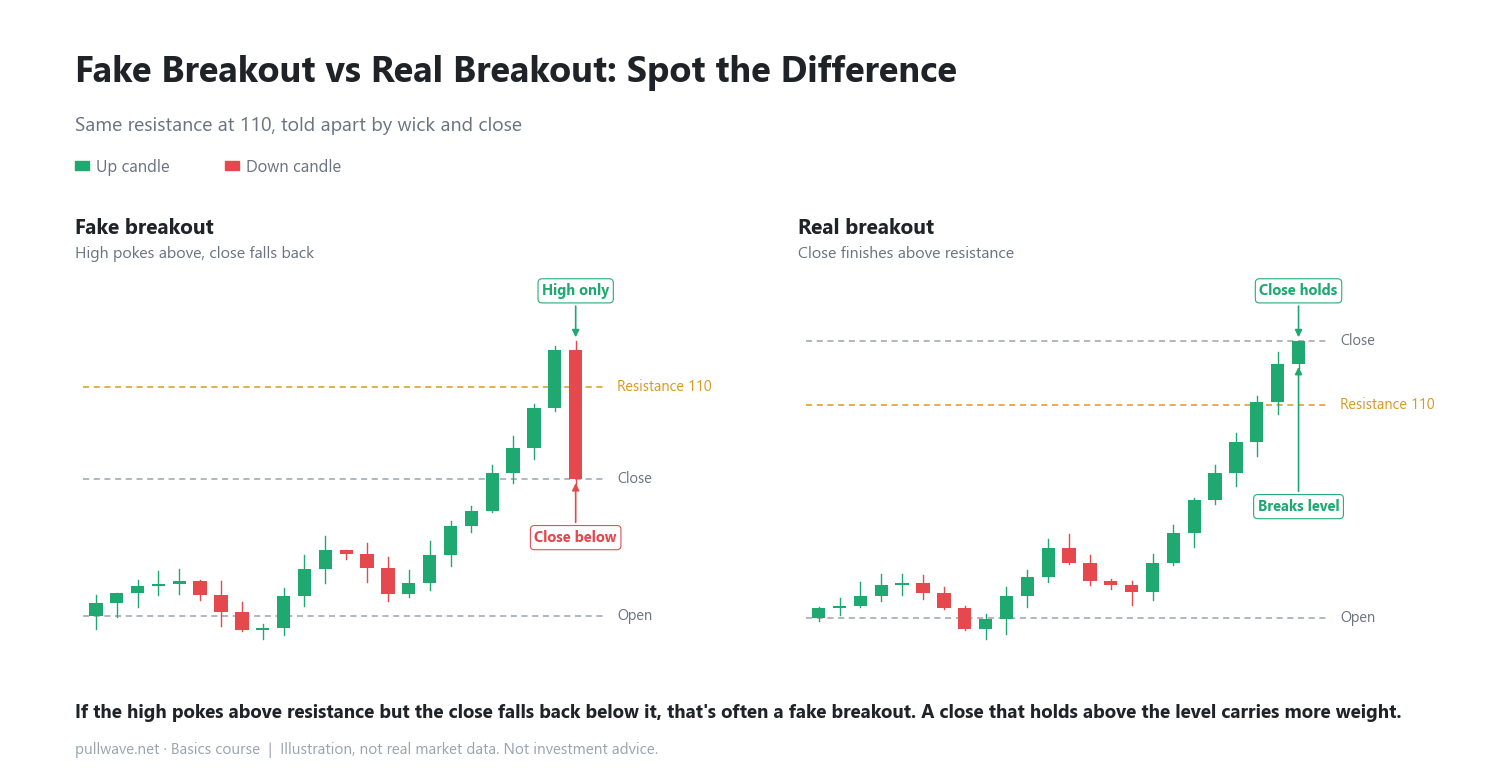
- A high that pokes above resistance but closes back below it is often a fake breakout
- A real breakout usually closes above the level and keeps trading there afterward
- Checking volume and a later retest adds more evidence to your read
In the previous lesson, you learned about the moment when resistance turns into support. Today we look at how to tell a real breakout from a fake one. A breakout happens when price moves past a key level like resistance or support. The tricky part is that price often appears to break through, only to snap back almost immediately. That snap-back pattern is what we call a fake breakout.
There's no way to spot every fake breakout in advance. But looking at the shape of the candle — the wick, the close, and volume — gives you useful clues about whether a breakout had real force behind it.
Core idea
Wick and close tell the story
A candle shows four prices: open, high, low, and close. The wick is where price traveled and then came back from; the body is the range between open and close. Say resistance sits at 110 in this illustration. If a candle opens at 108, spikes to a high of 112, dips to a low of 106, and closes at 107, the high poked above resistance but the close landed back below it. That is the classic shape of a fake breakout.
Volume adds context
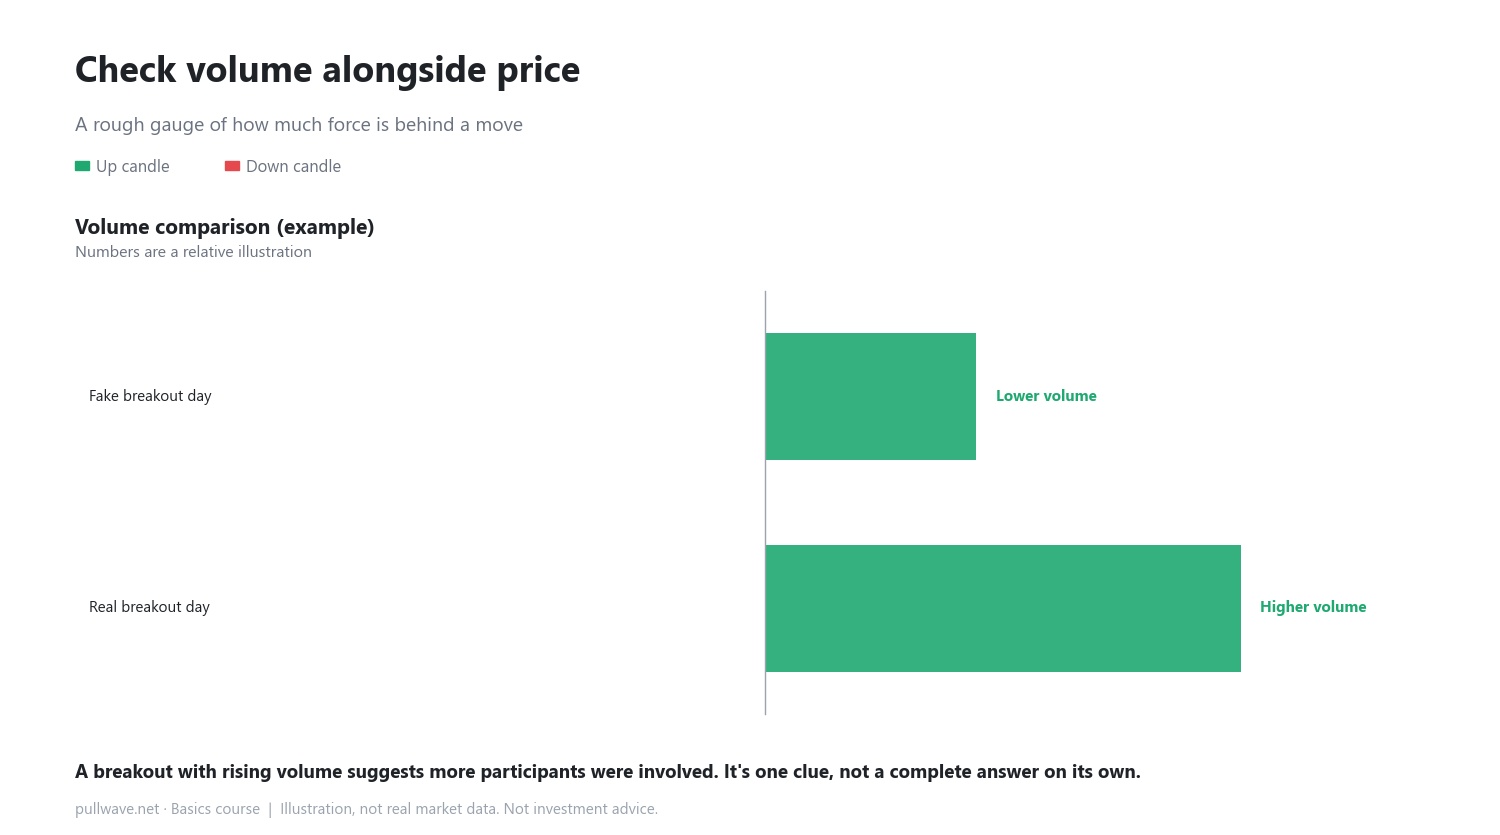
Volume is the amount traded during a period. When a breakout comes with volume higher than usual, it suggests more participants were involved in the move. If volume stays light while the high barely pokes above the level before reverting, the breakout likely lacked force. Still, volume alone can't settle the question — it's one clue among several.
What a real breakout tends to look like
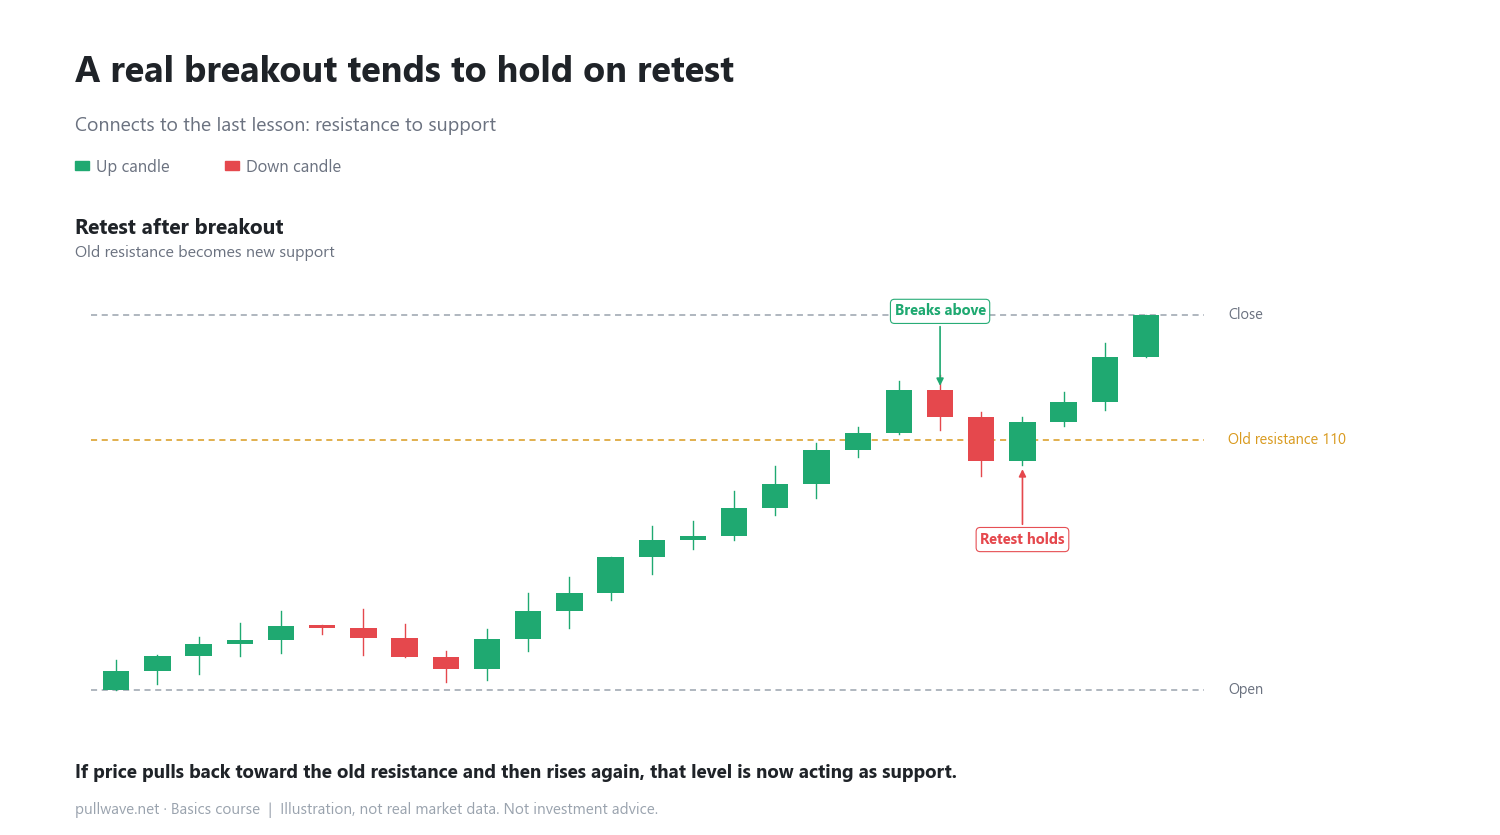
A real breakout usually closes above resistance, and the candles that follow keep trading above that level — what's often called follow-through. As covered in the last lesson, if price later pulls back toward that same level (a retest) and then rises again, that's a sign the old resistance is now acting as support.
How to use it on a real chart
On a live chart, avoid jumping to conclusions while a candle is still forming — a high wick mid-candle doesn't tell you much yet. Wait for that candle to close, then check whether the close landed above or below the level. After that, watch whether the next candle or two holds above the level and whether volume picked up alongside the move. Fake breakouts show up often on short timeframes (like a 5-minute chart), so it helps to also check a longer timeframe (like an hourly or daily chart) for context.
Common misconceptions
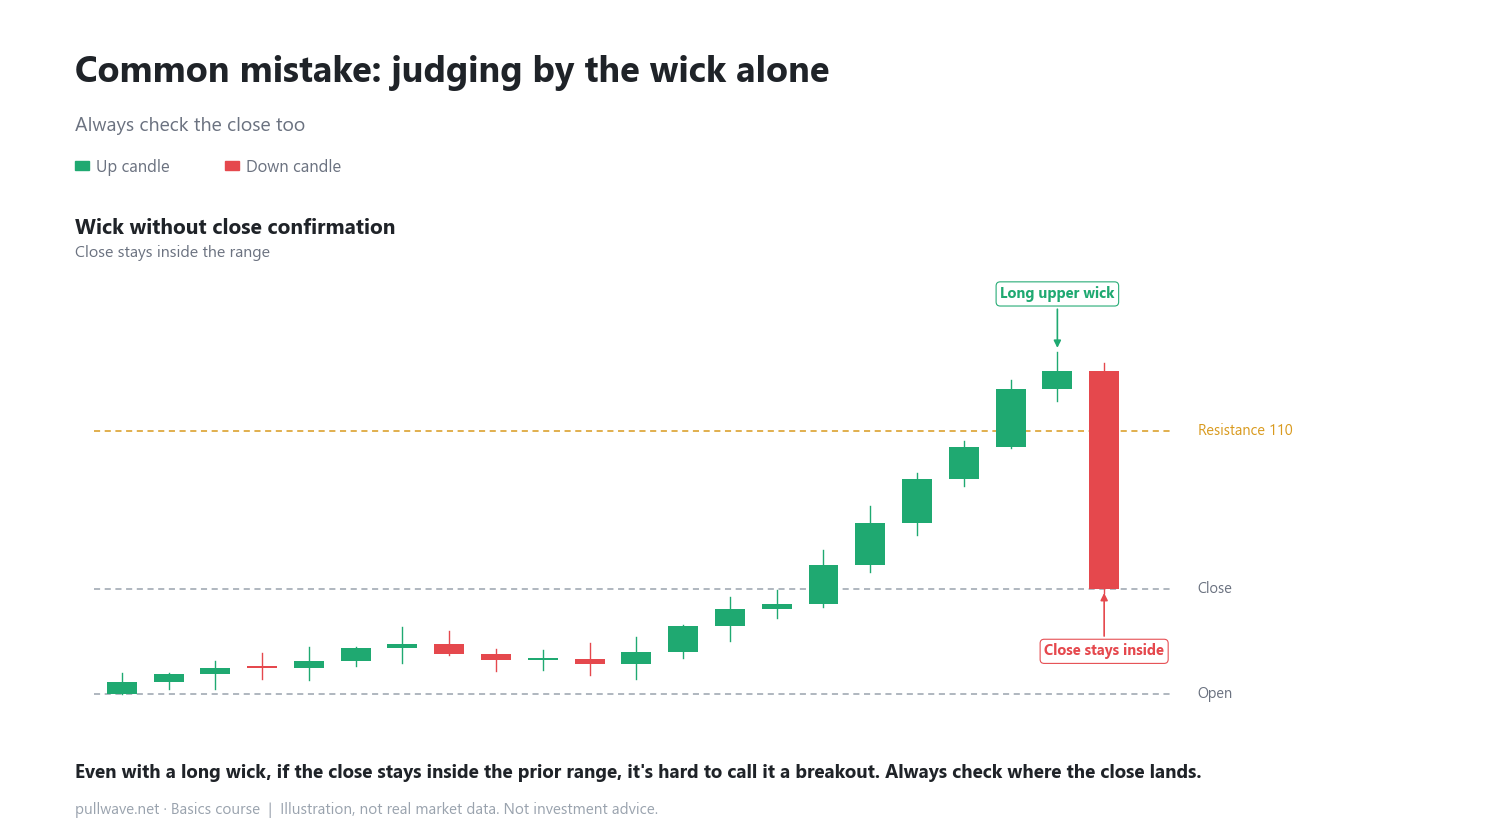
- A long wick always means a fake breakout: a long wick is just one clue; you still need to check where the close landed and what happened afterward.
- High volume always means a real breakout: volume shows how much force was behind a move, but it doesn't settle the outcome by itself.
FAQ
How can I quickly tell if a breakout is fake?
There's no instant method. Checking where the close lands when the candle finishes, and then watching whether the next candle or two hold above the level, gives you a stronger basis for judgment over time.
Should I treat every breakout with suspicion?
Not exactly. Rather than concluding anything from the high alone, building a habit of checking the close, the volume, and what follows gives you a clearer read on the structure.
General education, not investment advice. The picture is an illustration, not real market data.