Basics course · Lesson 27 · Part 4 · Indicator basics
When Volatility Shrinks, It Eventually Expands Again
At a glance
- Volatility tends to alternate between squeeze and expansion.
- A squeeze carries no information about direction.
- Look for shrinking candle bodies and wicks to spot a squeeze.
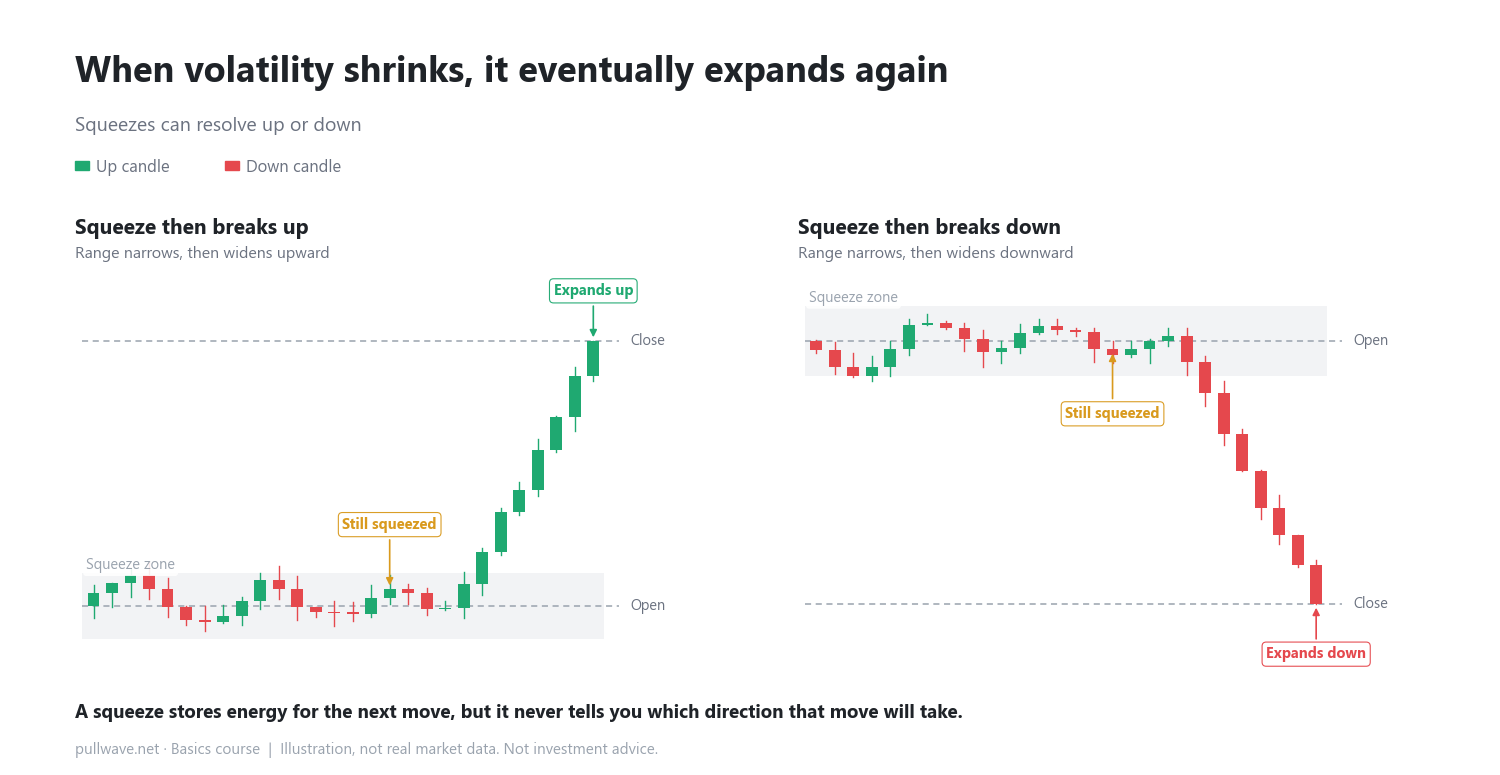
Volatility describes how much price moves over a given period. When daily price swings are small, we say volatility is low; when price swings widely up and down, volatility is high. Volatility rarely moves in a straight line — markets tend to alternate between periods when the range narrows (a squeeze) and periods when the range widens again (an expansion).
In the previous lesson we looked at why indicators react later than price itself. The squeeze-and-expansion pattern is something you can often notice directly on the candles, before any indicator confirms it. When candle bodies and wicks generally get shorter across several bars, that is a sign that volatility is contracting.
Volatility alternates between squeeze and expansion
What a squeeze looks like
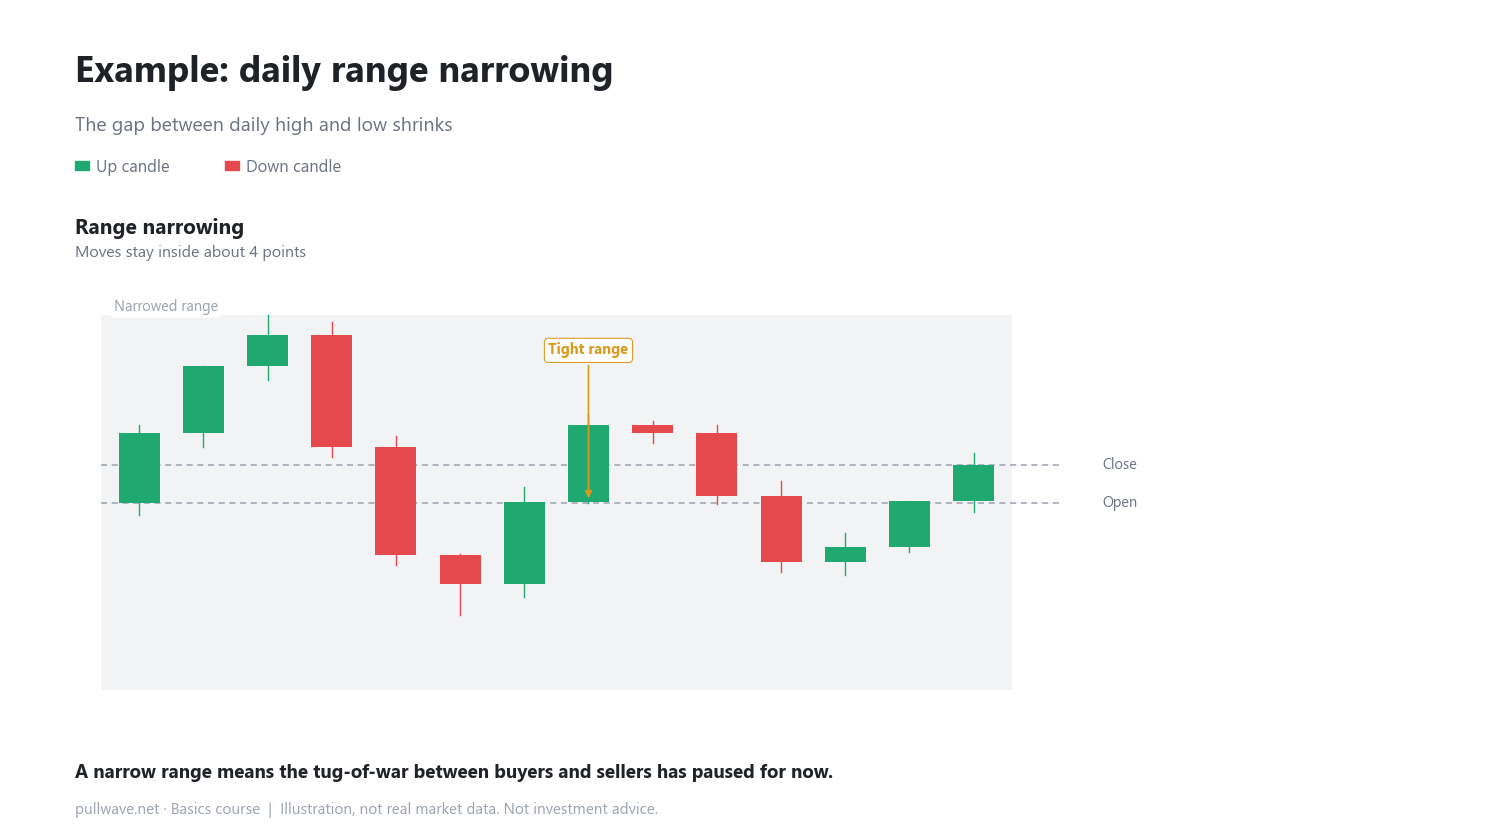
Say price has been moving between 98 and 102 for several days, in this illustration. If the daily range (high minus low) keeps sitting around 4, that tells you participants are mostly standing still rather than pushing hard in one direction. The narrower the range gets, the more it is often described as "storing up energy" for the next move.
Expansion can go either way
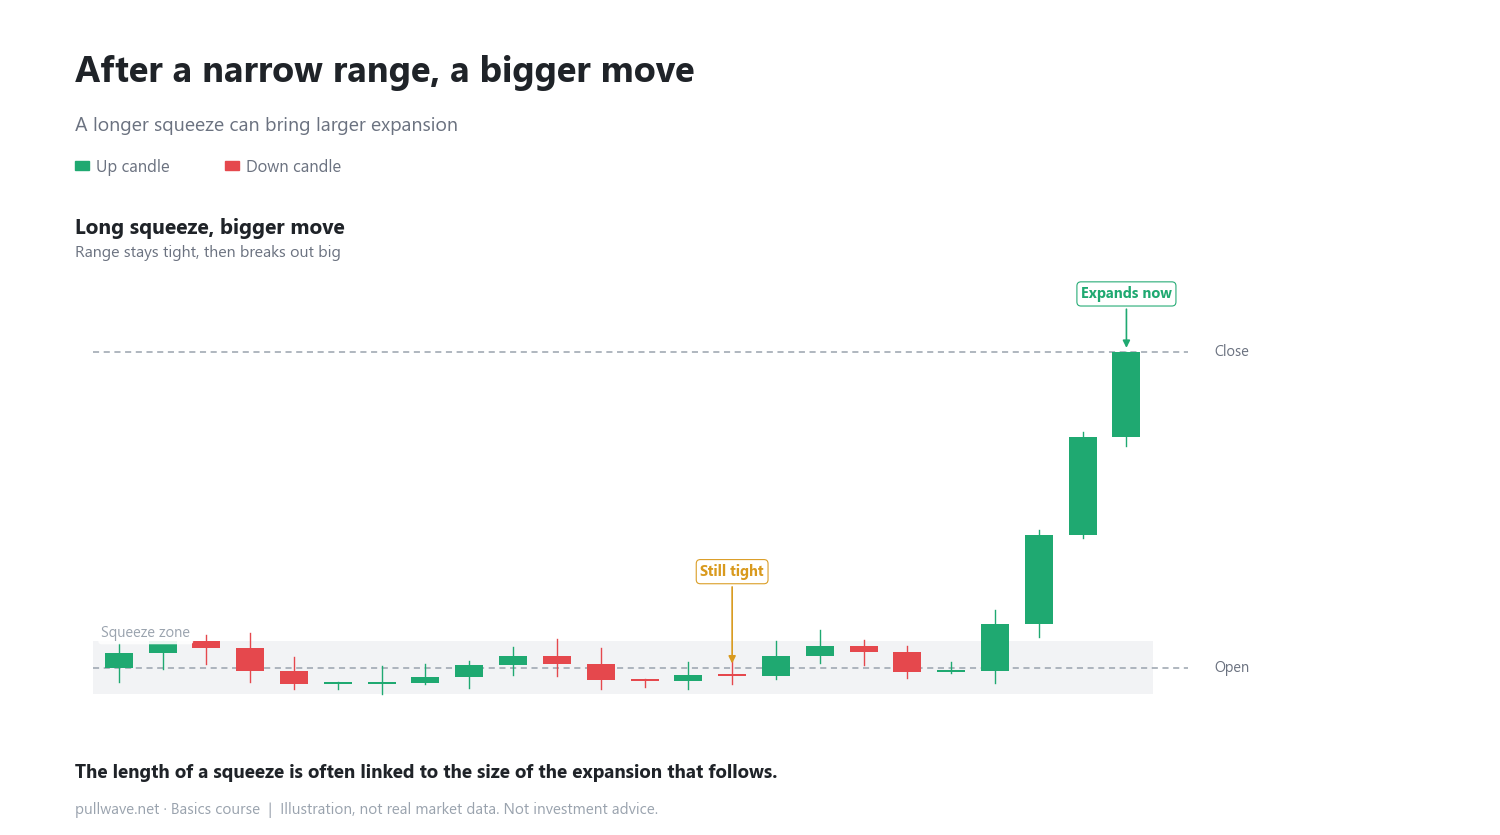
Once a squeeze ends, the range usually widens again. The problem is that looking at the squeeze alone cannot tell you whether the expansion will go up or down. The same quiet 98-102 range could later jump to 116 on one occasion, or drop to 85 on another, purely as an illustration. It's commonly observed that a longer squeeze can be followed by a larger expansion, though not always.
The squeeze itself doesn't tell you the direction
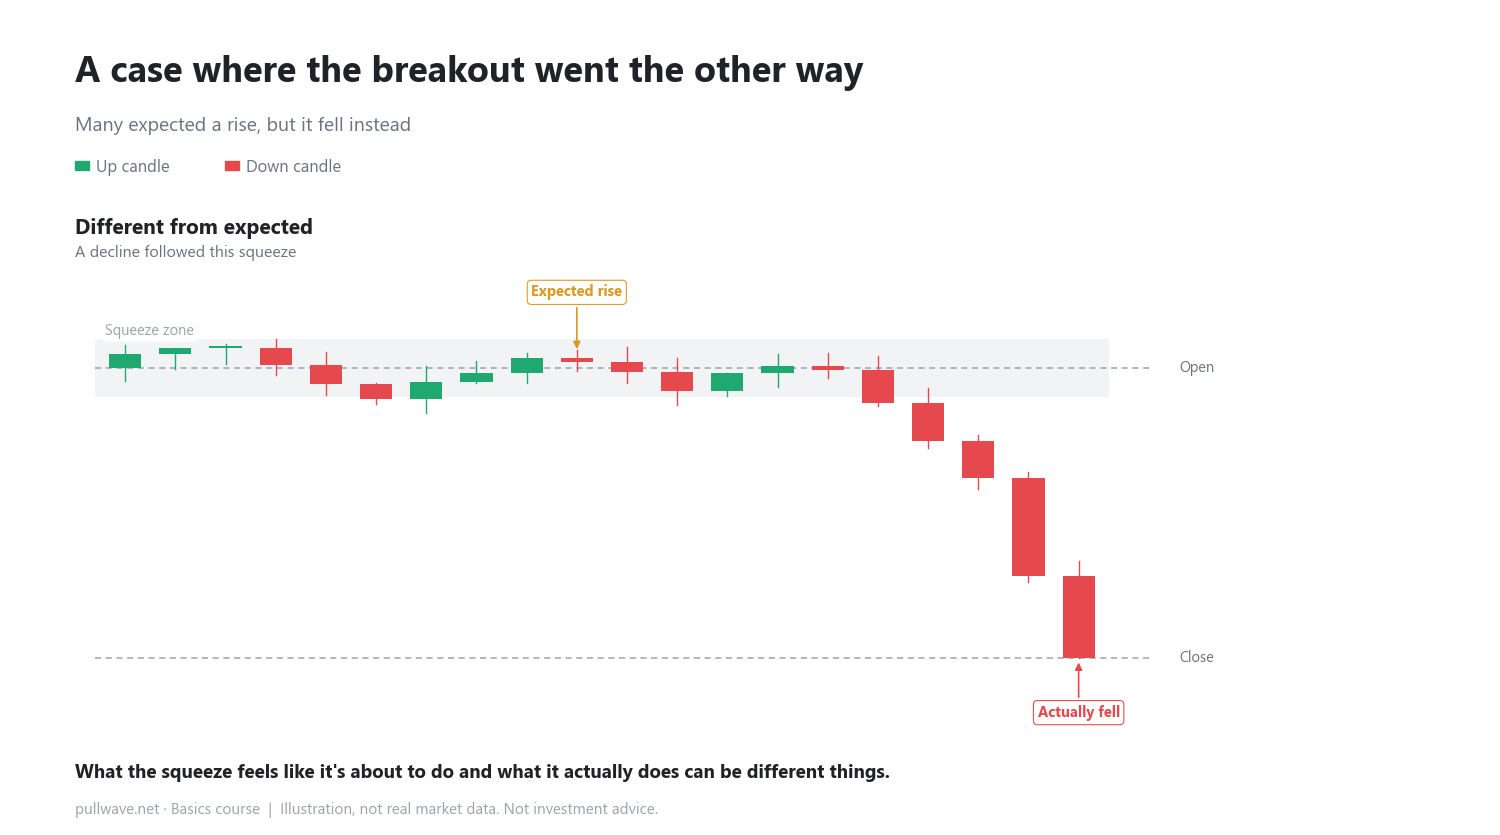
When traders see a squeeze, it's natural to think "it's been this quiet, so it should go up next." But a squeeze carries no information about direction by itself. The exact same-looking squeeze has, in different cases, been followed by a move up and by a move down.
How to use it on a real chart
On a real chart, look for stretches where candle bodies generally shrink and wicks on both sides get shorter. Watching a moving average alongside price can help — during a squeeze, price tends to stay tightly wrapped around that line. The key practical point is not to assume a direction just because you expect a move "soon."
Common misconceptions
- Believing that a longer squeeze guarantees a big move upward — a bigger move happening and that move going up are two separate claims.
- Assuming expansion must start on the very next candle after the range narrows — a squeeze can continue for days or even weeks.
FAQ
Is there a fixed number of candles a squeeze should last?
No fixed length exists. It varies by market and by timeframe, lasting anywhere from a few days to several weeks. Instead of memorizing a specific count, it helps to build the habit of simply noticing when the range is smaller than usual.
Can the direction of the breakout be known in advance from the squeeze itself?
No. The squeeze by itself carries no directional information. Direction only becomes visible once the expansion actually begins to show up in the candles — assuming a direction before that happens is closer to guessing than analysis.
General education, not investment advice. The picture is an illustration, not real market data.