Basics course · Lesson 26 · Part 4 · Indicator basics
Why Do Indicators React Late?
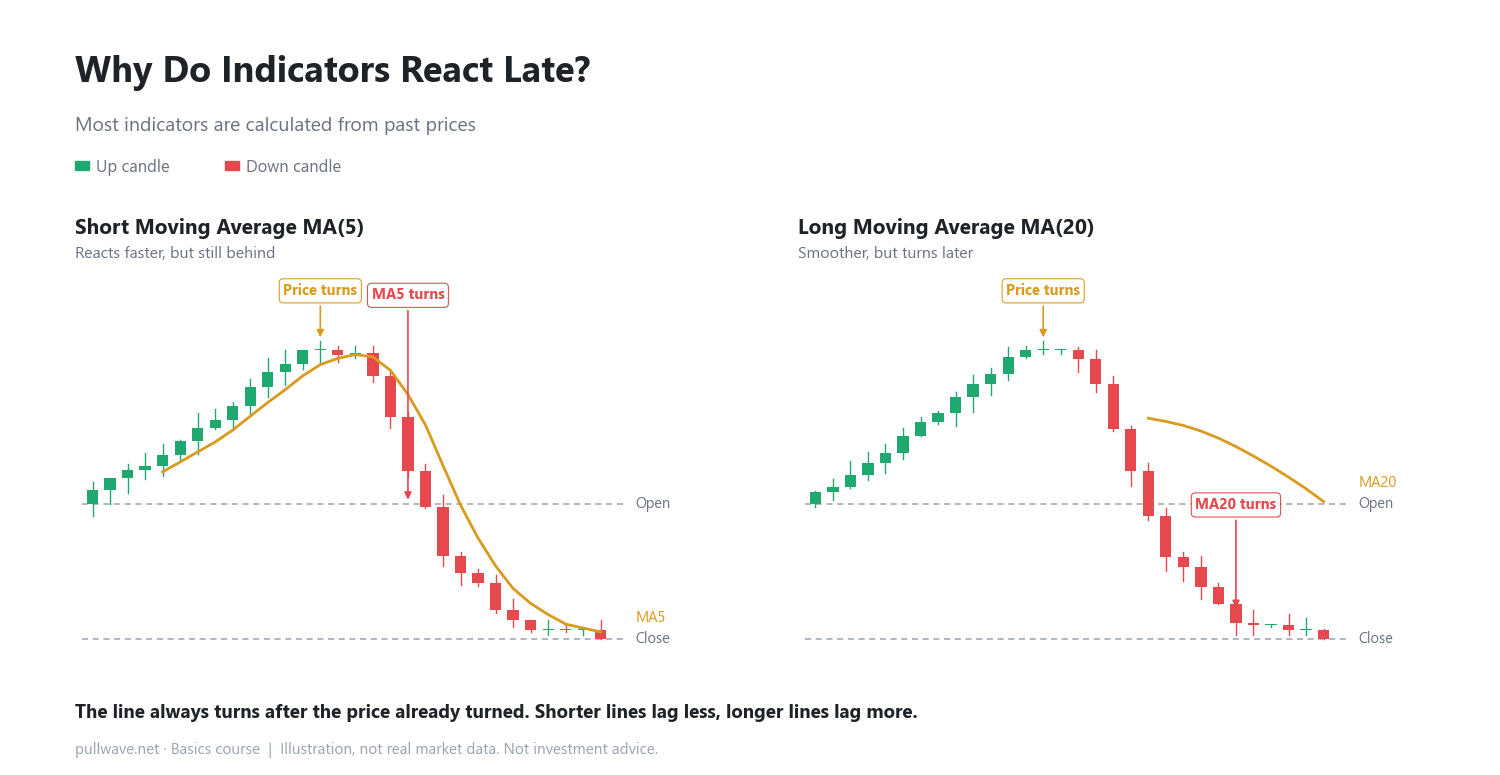
At a glance
- Most indicators are built from past prices, so they turn after price already has
- Shorter periods react faster but create more false signals; longer periods are smoother but later
- Treat indicators as confirmation tools, not early warnings
In the last lesson, we learned that a moving average is simply an average of recent prices. Today we look at why that moving average — and most indicators built on it — always react a step behind the price.
Most indicators are calculated from prices that have already happened. No matter how sharply today's price changes direction, an indicator only turns after that change has accumulated across several candles. This is called "lag": price moves first, and the indicator follows.
Why indicators lag
The calculation itself uses past data
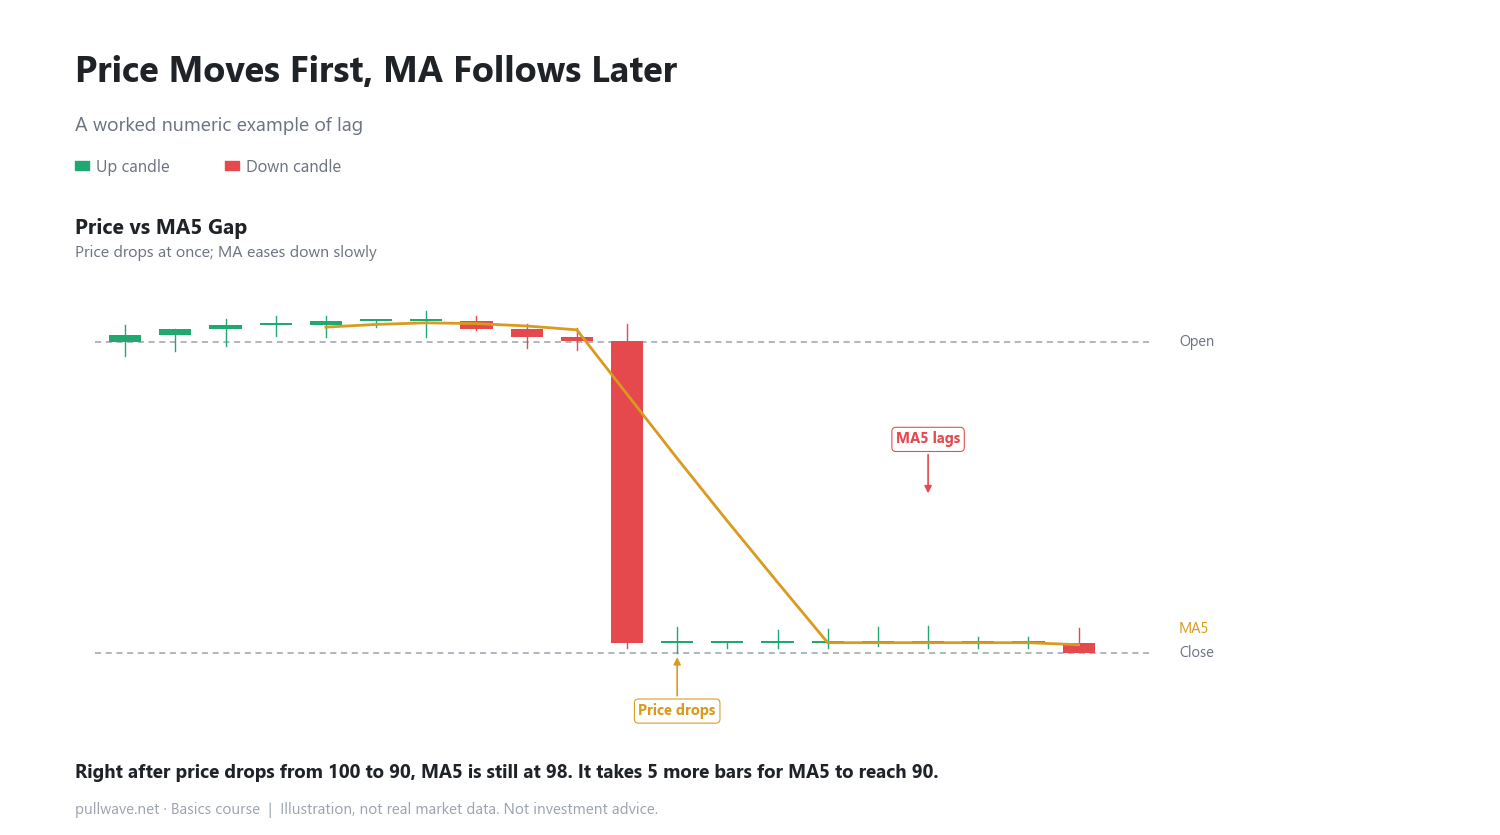
A moving average (MA) is the average of the closing prices of the last n candles. MA(5), for example, averages the last 5 closes. Say price sat at 100 for five candles in a row, then suddenly dropped to 90. On the first candle after the drop, MA5 becomes (100+100+100+100+90) divided by 5, which is 98. Price is already at 90, but the indicator still shows 98. It takes five more candles of closes at 90 before MA5 itself reaches 90. In other words, it takes time for the indicator to catch up to the price.
Make it faster: more false signals
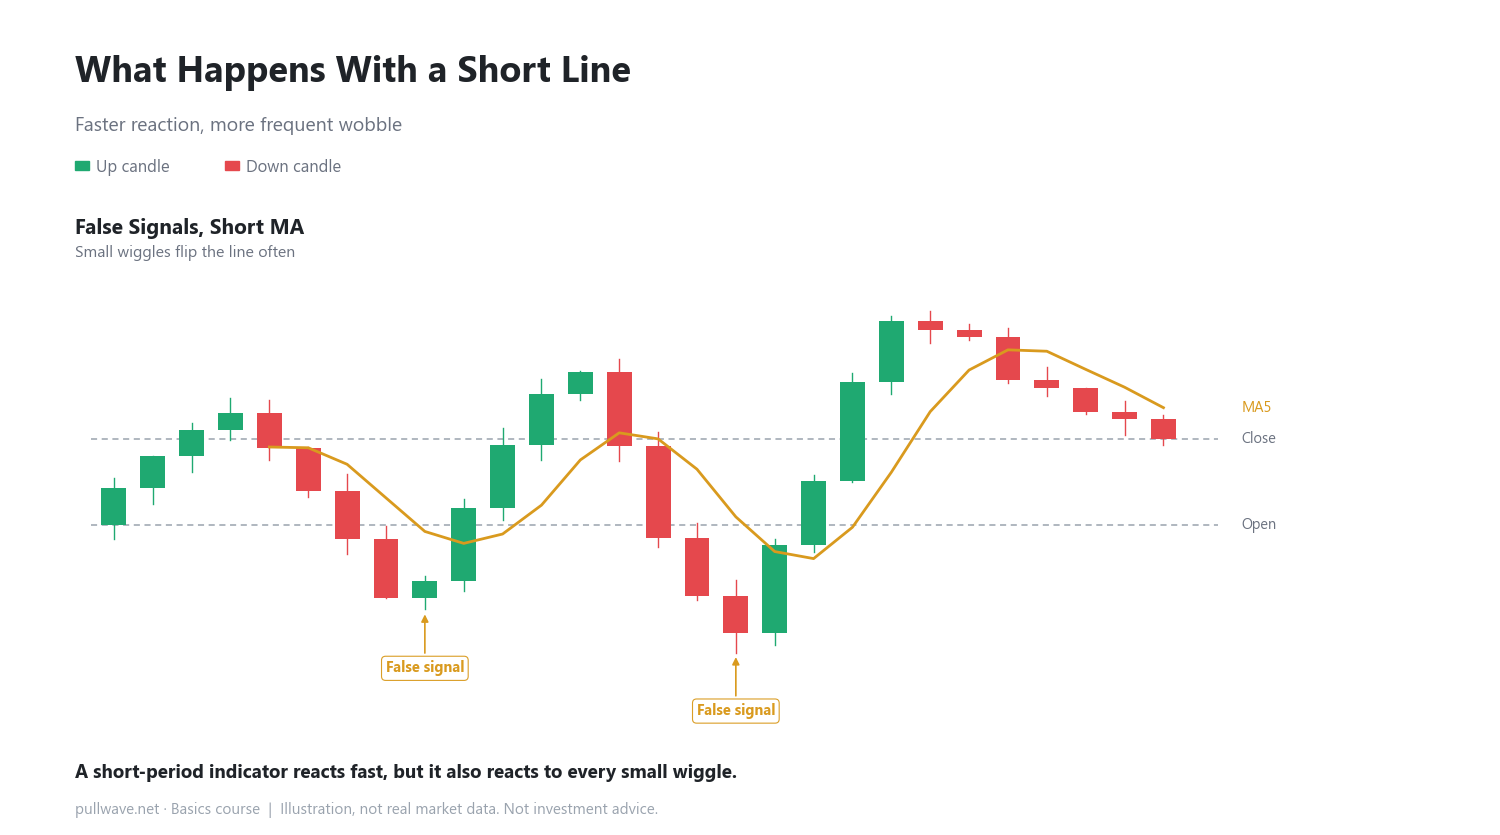
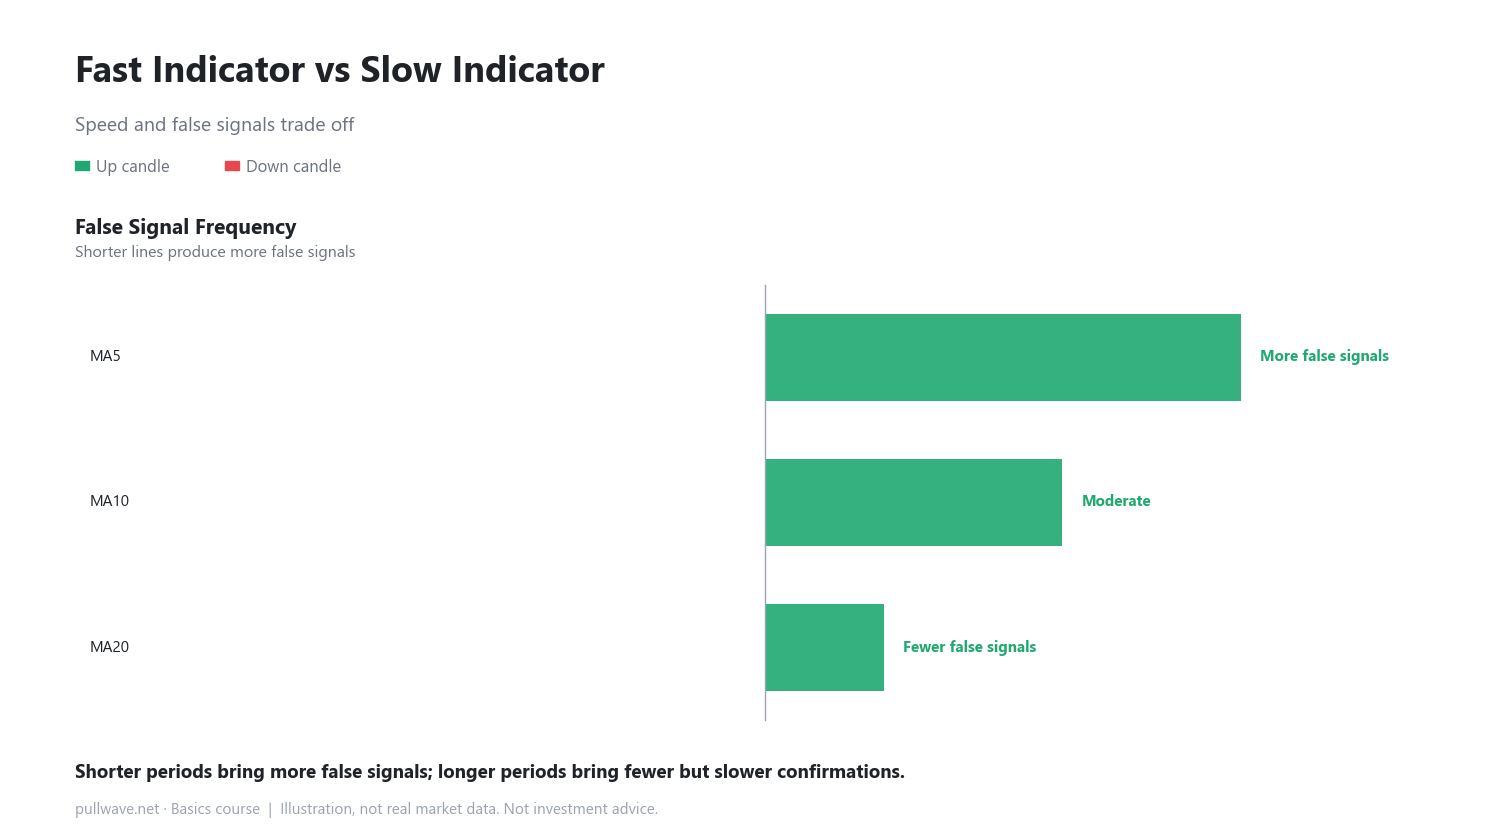
Using a shorter period (like MA5) makes the indicator turn sooner. But it also reacts to small wiggles, so it frequently produces false signals — turns that look like a trend change but aren't.
Make it slower: signals arrive too late
Using a longer period (like MA20) smooths the line and reduces false signals, but the indicator may only confirm a turn long after price already moved — by which point price has often traveled a long way.
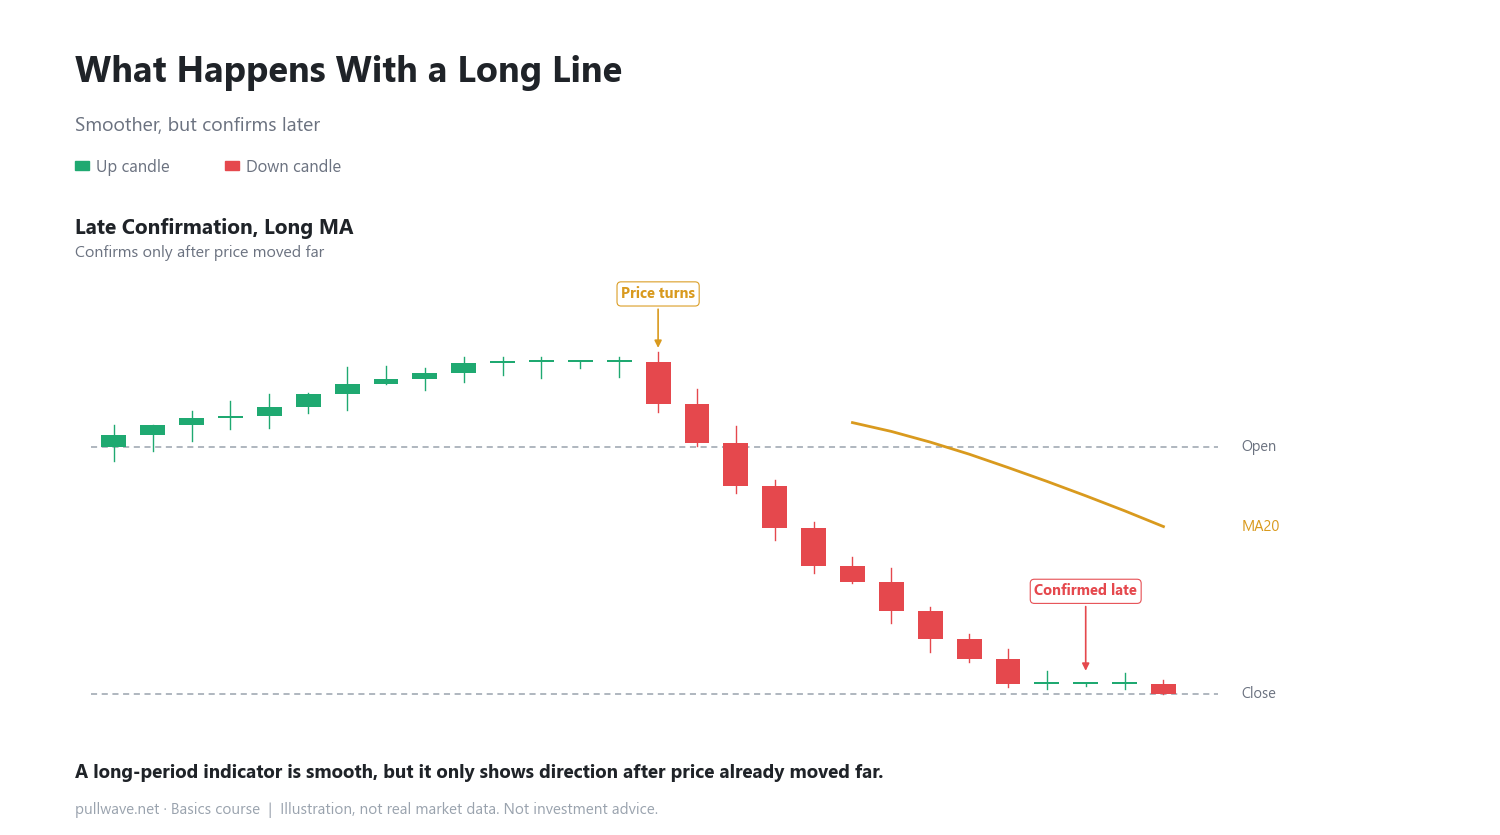
This is an unavoidable trade-off with any indicator: faster means more false signals, slower means later confirmation. Neither side is simply better — it depends on what you're trying to do.
How to use it on a real chart
When you watch an MA turn on a chart, the actual high or low in price usually happened several candles earlier. Keep in mind that by the time an indicator tells you direction changed, price has often already moved quite a bit. Placing a short-period and a long-period line on the same chart lets you see, visually, how differently they lag. It helps to treat the indicator as one more reference alongside the raw price action, not the sole basis for a judgment.
Common misconceptions
- "When the indicator turns, that's when price turned" — not true. Price turns first; the indicator only shows it afterward.
- "Shortening the period solves everything" — not true. It reduces lag but increases false signals.
FAQ
Does that mean indicators are useless?
No. Indicators are tools that organize price action into something easier to read. Just understand that they tend to confirm a move rather than announce it in advance.
How do I choose the right period?
There's no single correct answer. Understand the trade-offs between shorter and longer periods, then experiment based on the timeframe you're watching and what you're trying to accomplish.
General education, not investment advice. The picture is an illustration, not real market data.