Basics course · Lesson 25 · Part 4 · Indicator basics
A Moving Average Is Just an 'Average Price'
At a glance
- A moving average is just the average of the last N closes
- A short MA (small N) reacts fast; a long MA (large N) reacts slowly
- Price above or below the line is positional info, not a forecast
In the last lesson, you learned how volume helps gauge the strength behind a price move. This time we'll look at one of the most basic indicators of all: the moving average (MA). Despite the fancy name, a moving average is simply the average of the last N closing prices, connected into a line.
N is just a number you choose — how many recent closes to average together. A smaller N reacts quickly to recent price changes, while a larger N includes more history and moves more slowly. There's no single 'correct' N; it's a tool you adjust depending on what you're trying to see.
The core idea
How the average is calculated
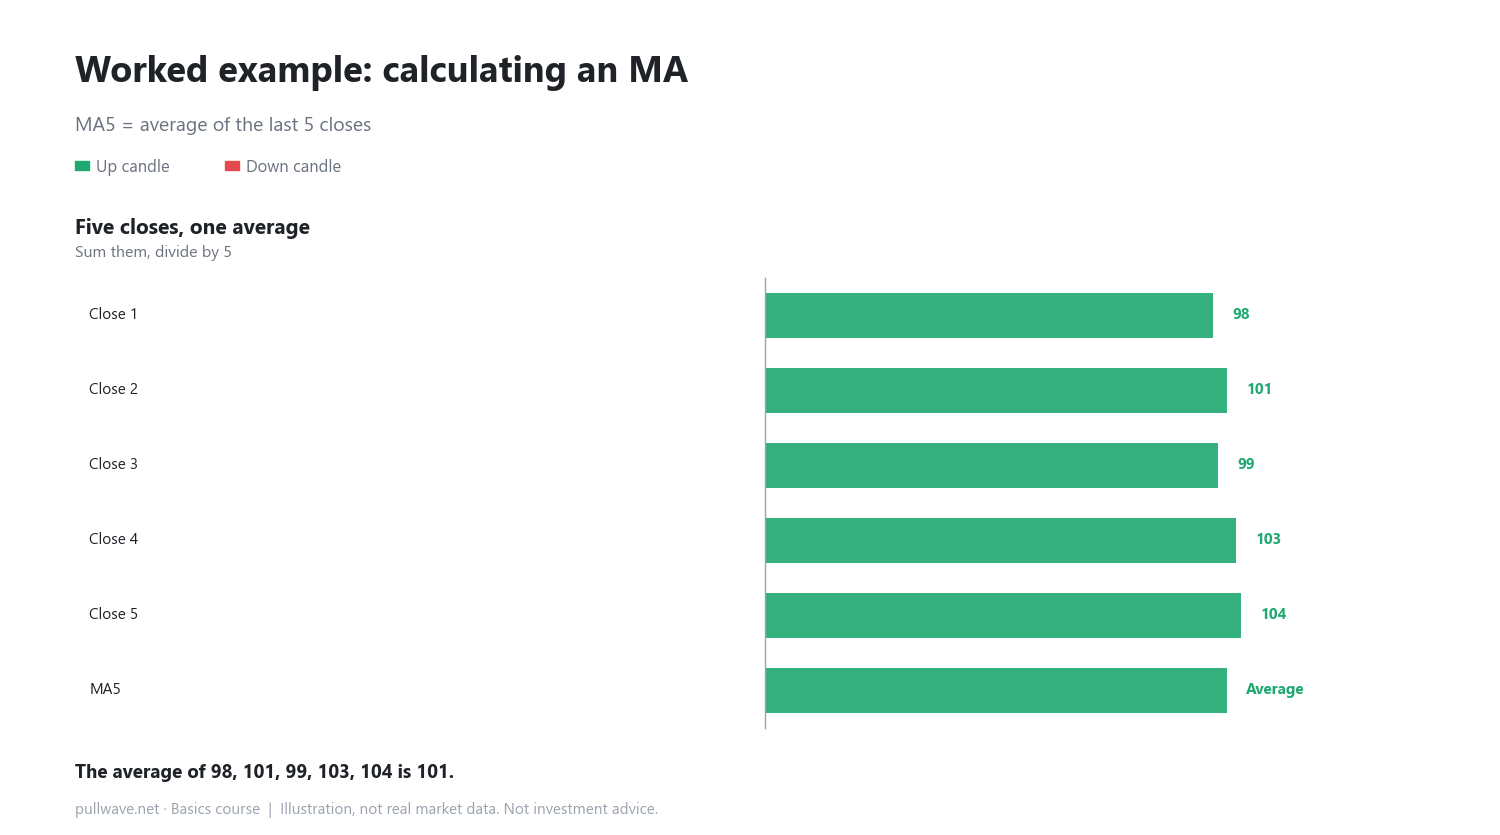
Say the last five closing prices were 98, 101, 99, 103, and 104 (all made-up numbers for illustration). Add them up and you get 505; divide by 5 and you get 101. That 101 is today's value of the '5-period moving average' (MA5). When a new candle forms, you drop the oldest close (98) and add the newest one, then average again. That's why the moving average looks like a smooth line — it's constantly being recalculated with a rolling window of prices.
Short line vs. long line: speed
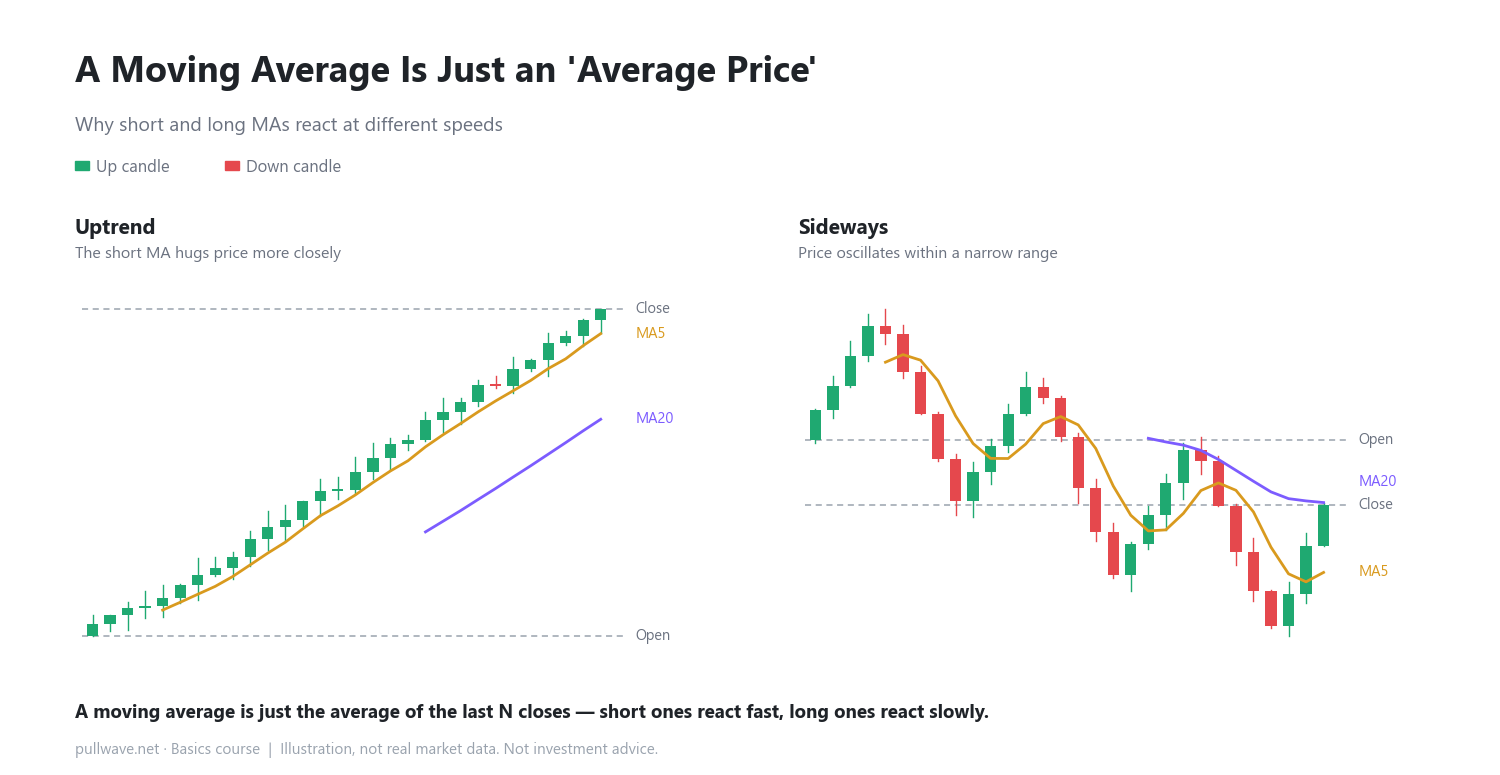
In the left panel of the main illustration, price rises steadily while both a short MA (5) and a long MA (20) are drawn over it. The short line only averages the last 5 values, so it tracks price changes more closely. The long line averages 20 values, so it lags a bit and moves more smoothly. In the right panel, where price oscillates within a narrow range, both lines stay close to price and to each other.
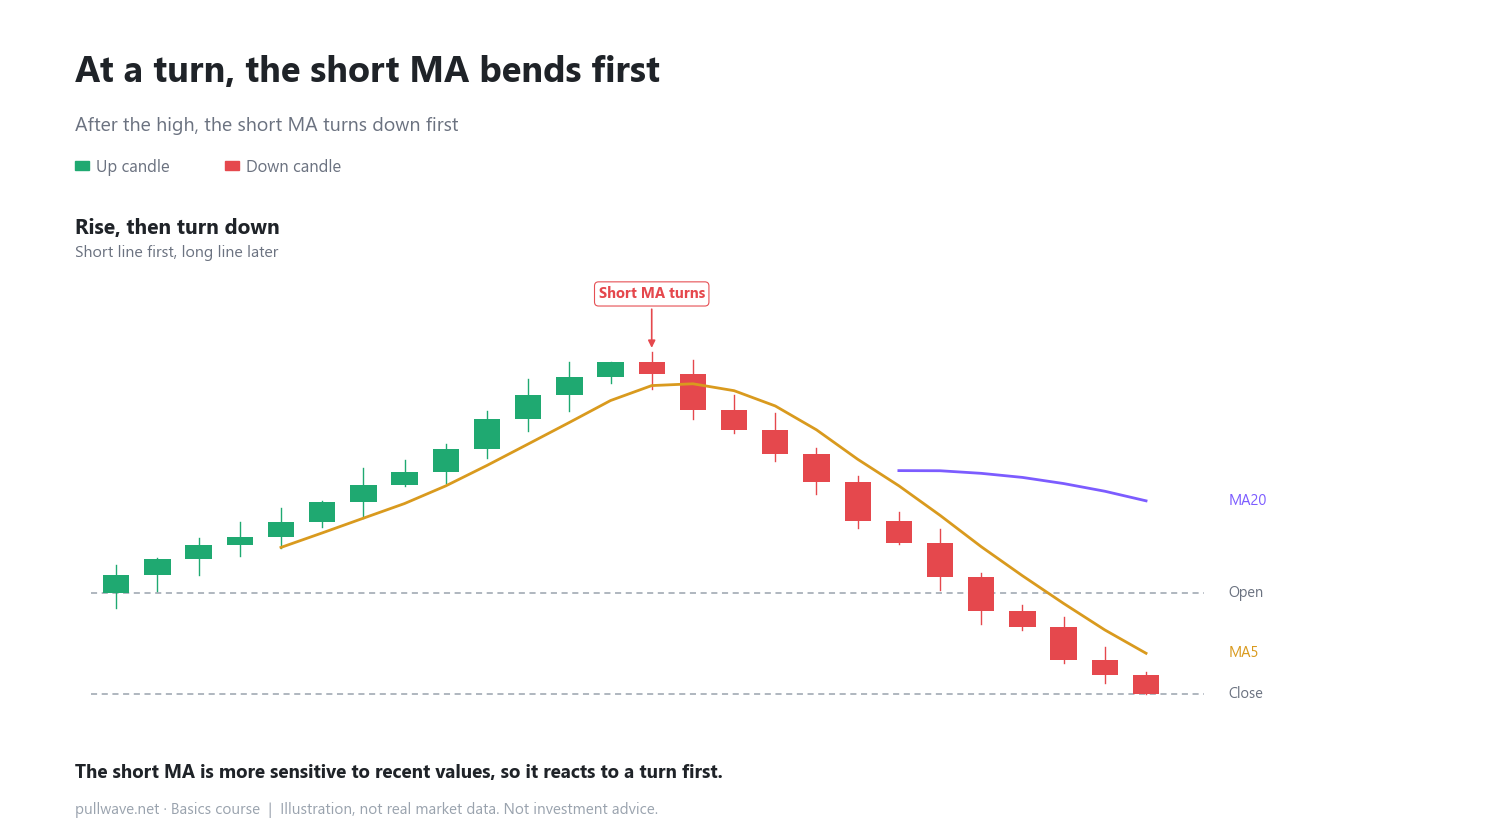
The speed difference shows up most clearly when price direction changes. When price makes a high and starts turning down, the short line — being more sensitive to recent values — tends to bend first, while the long line keeps moving in the old direction a little longer before catching up. This isn't a special signal or formula; it's just a basic property of averaging over different window sizes.
What it means when price is above or below the line
When price is above a moving average, it simply means the current price is higher than the recent average. Below the line means the opposite. On its own, this doesn't tell you where price is headed next — it's just positional information showing where price sits relative to its recent average. Price naturally crosses above and below moving averages many times as it moves.
How to use it on a real chart
On a real chart, traders often plot several moving averages of different lengths at once and watch where price sits relative to each one, and how the short and long lines are arranged relative to each other. A line bending, or two lines moving closer together or apart, can be a reference point suggesting that trend strength is changing — but it's best read alongside other information (like volume) rather than treated as a standalone conclusion.
Common misconceptions
- Thinking "price is above the MA, so it will keep rising" is a misconception. The line is just a past average; it doesn't guarantee the future.
- Thinking "changing N makes the line more accurate" is also a misconception. N only adjusts how fast the line reacts — it isn't a number you can solve for.
FAQ
What N should I use for a moving average?
There's no fixed correct answer. A short N reacts quickly but picks up more noise; a long N is slower but steadier. Think of it as a tool you choose based on your purpose and timeframe.
Does price crossing a moving average mean something right away?
Not on its own. Price often crosses back and forth across a line temporarily, so it's worth confirming with other indicators or the broader price action before drawing conclusions.
General education, not investment advice. The picture is an illustration, not real market data.