Basics course · Lesson 9 · Part 2 · Reading candles
Change the timeframe, and the candle looks different
At a glance
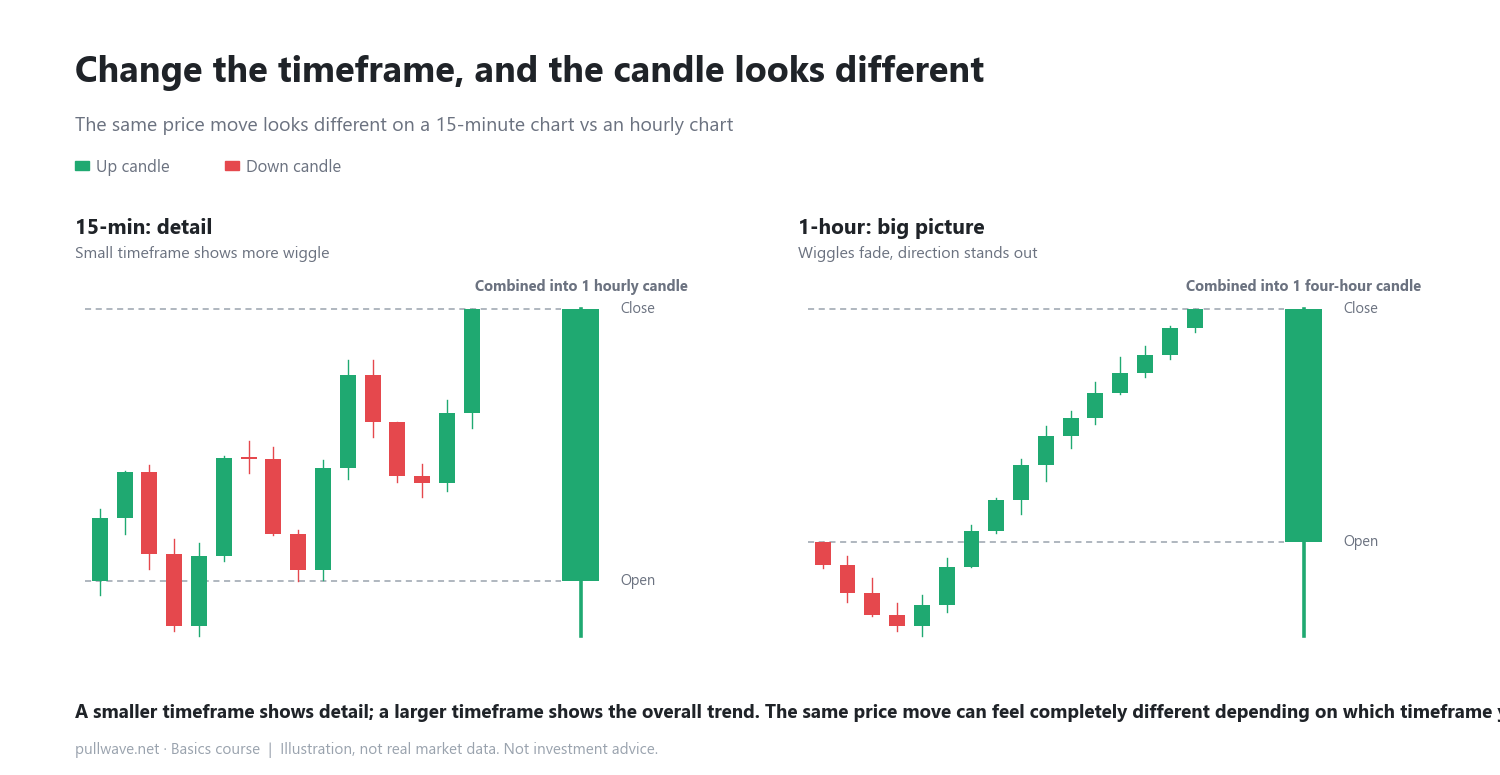
- One hourly candle equals four 15-minute candles
- Larger timeframes show trend, smaller ones show detail
- The same price move looks different across timeframes
In the previous lesson, you learned that a single candle holds four pieces of information: open, high, low, and close. In this lesson, you'll learn that the same price action can look completely different depending on how much time each candle represents.
The length of time one candle covers is called a timeframe. A 15-minute candle shows 15 minutes of price action. A 1-hour candle shows one hour. Longer timeframes include the 4-hour chart and the daily chart, among others.
Timeframes are multiples of each other
One hour contains four 15-minute periods. So one 1-hour candle is really just four 15-minute candles combined into one. In the same way, one 4-hour candle equals sixteen 15-minute candles, and one daily candle (24 hours) equals ninety-six 15-minute candles.
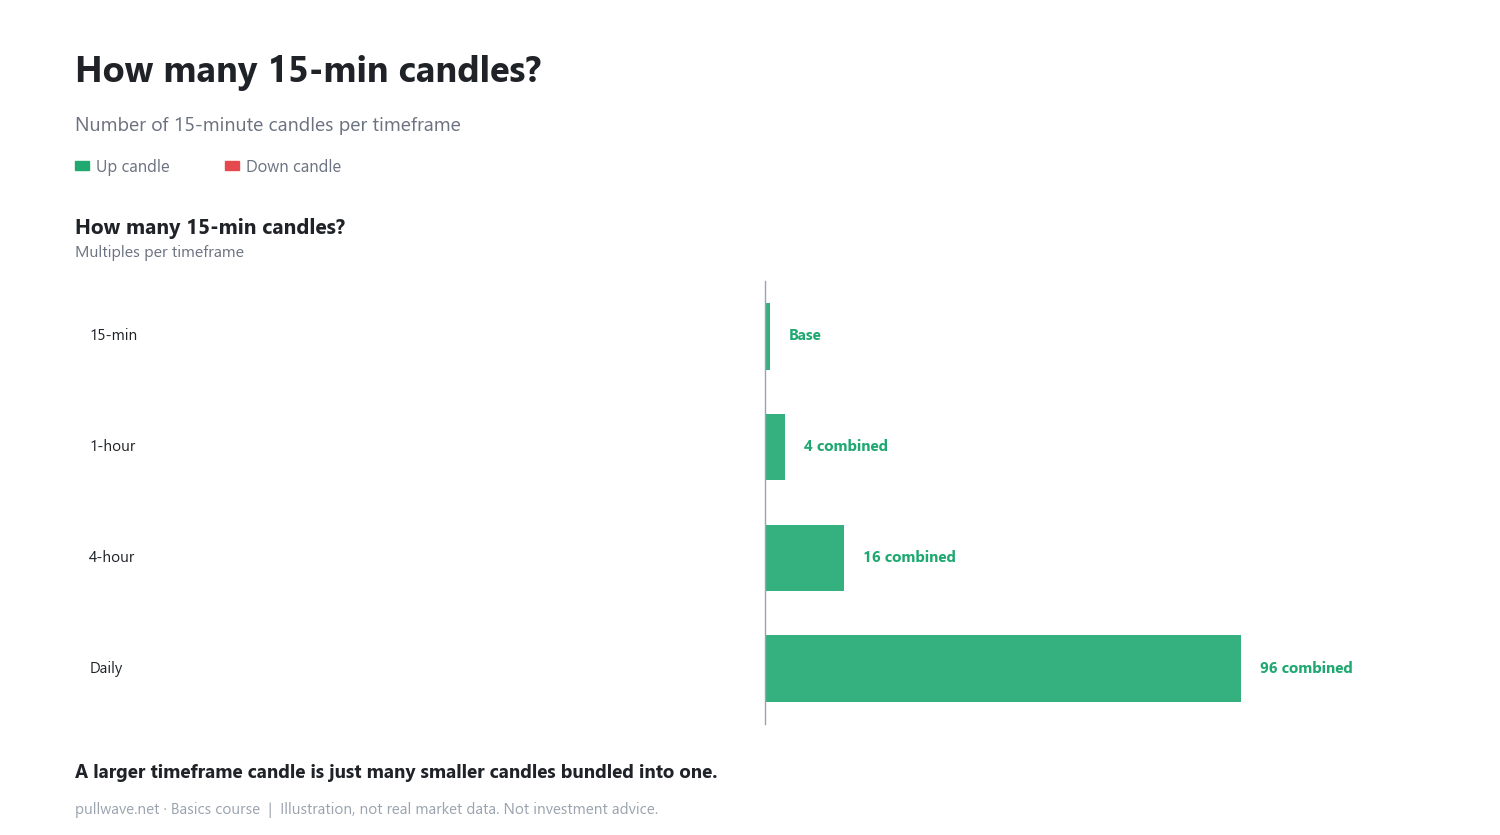
How smaller candles combine into a bigger one
The rule for combining candles is simple. The open of the very first small candle in the group becomes the open of the bigger candle. The close of the very last small candle becomes the close of the bigger candle. The highest price reached anywhere in the group becomes the high, and the lowest price reached becomes the low.
Here's a simple illustration. Suppose four 15-minute candles moved like this (the numbers are just for illustration):
- First candle opens at 100
- Second candle reaches a high of 103
- Third candle reaches a low of 99
- Fourth candle closes at 101
Combine these four, and the resulting 1-hour candle has an open of 100, a high of 103, a low of 99, and a close of 101. All the small wiggles inside disappear — only the overall result remains.
Bigger timeframe = trend, smaller timeframe = detail
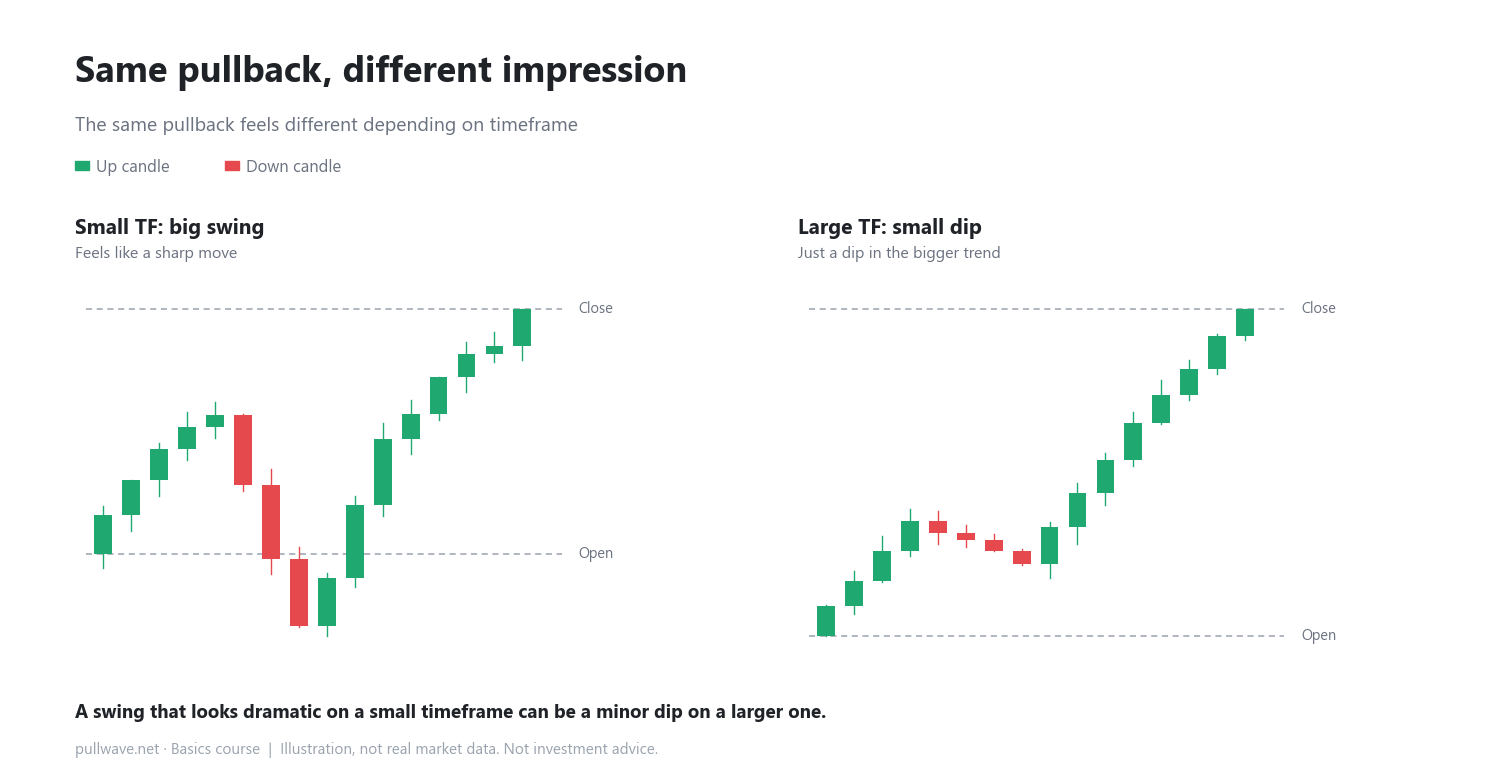
On a small timeframe, price looks like it's bouncing around often and sharply. Look at the same period on a larger timeframe, and those bounces cancel each other out, leaving a smoother, simpler-looking move. Neither view is "wrong" — they're the same reality shown at different levels of zoom.
How to use it on a real chart
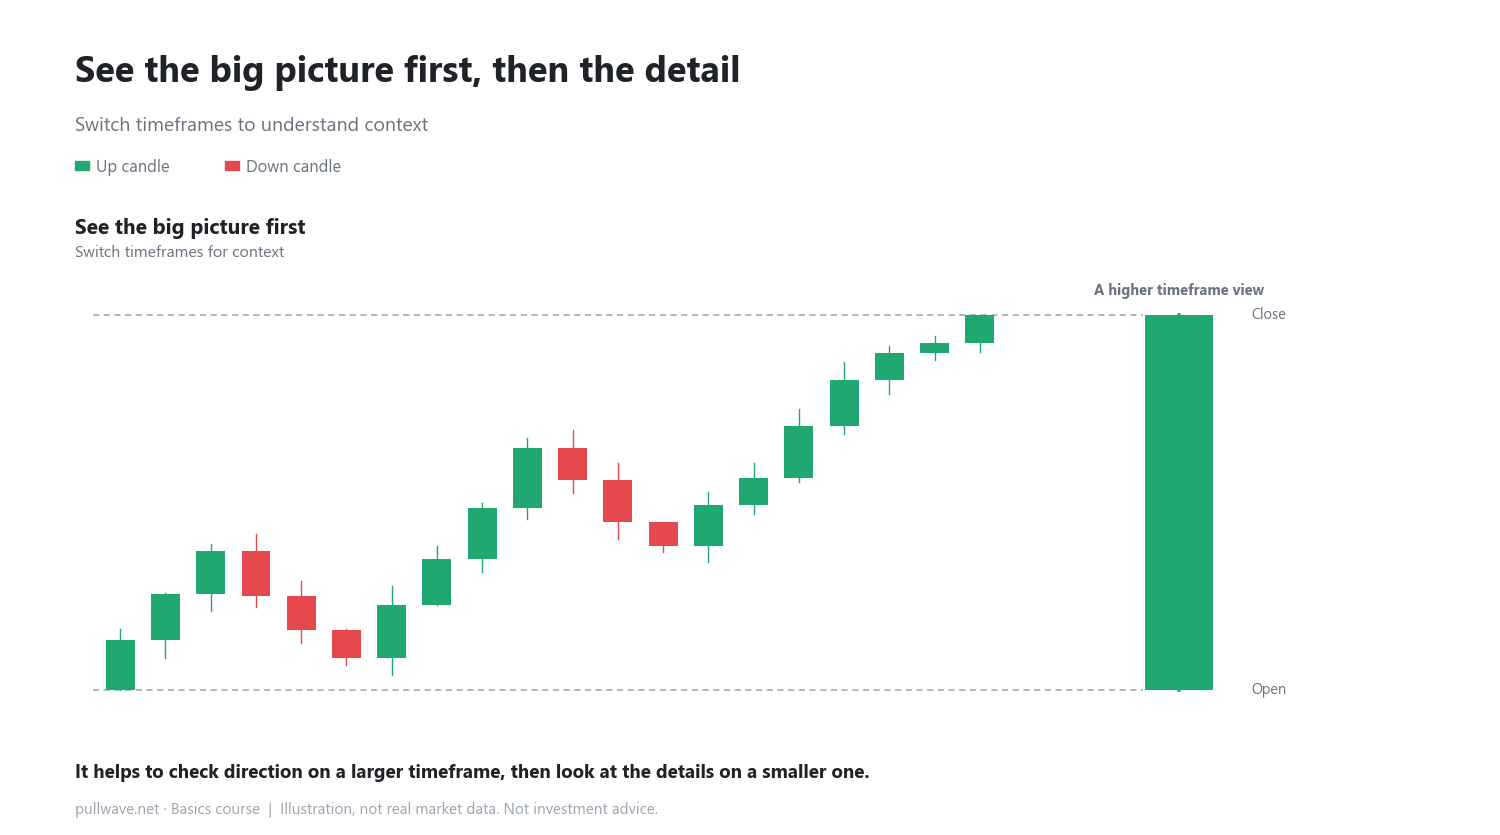
A useful habit is to start by checking a larger timeframe to understand the overall direction and general mood of the market. Then zoom into a smaller timeframe to study the details. Looking only at small timeframes makes it easy to get thrown off by minor wiggles; looking only at large timeframes makes it easy to miss useful detail.
Common misconceptions
- When a small-timeframe candle swings sharply, it's tempting to think something major is starting. On a larger timeframe, that same swing often turns out to be a small dip within a bigger move.
- It's easy to assume different timeframes show different information. In reality, they show the exact same price data, just grouped into different lengths of time.
FAQ
Which timeframe is more accurate?
No timeframe is more "accurate" than another. Both summarize the same price data in different ways. Use a larger timeframe to see the big picture, and a smaller one to see detail.
Do I need to watch both the 1-hour and 15-minute charts together?
You don't have to, but looking at more than one timeframe can give you a fuller picture of the same price move. If you're just starting out, it helps to get comfortable with one timeframe first, then gradually add others.
General education, not investment advice. The picture is an illustration, not real market data.