Basics course · Lesson 8 · Part 2 · Reading candles
Reading One Candle: Open, High, Low, Close
At a glance
- A single candle packs in the open, high, low, and close
- The body shows net movement; wicks show where price went and returned
- Smaller candles combine to form one larger candle
In the last lesson, you learned how orders get filled — market, limit, and stop orders. Now let's look at how all those filled prices get summarized into a single candle on the chart. Once you can read a candle, a messy-looking chart starts to make a lot more sense.
Four prices packed into one candle
A single candle compresses everything that happened during a fixed time period (like one hour or one day) into just four numbers.
Open, High, Low, Close
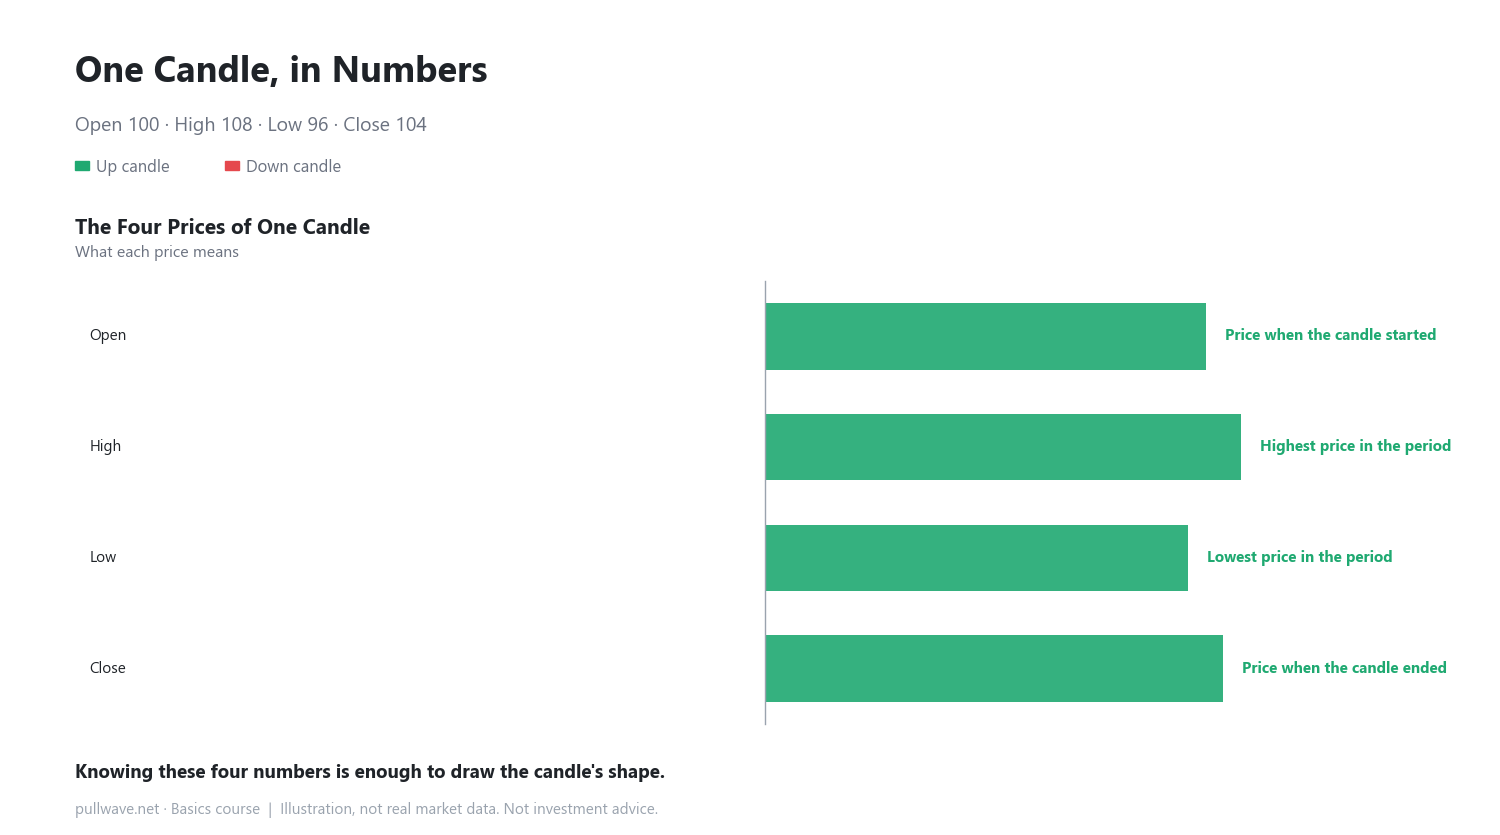
- Open: the price when that period started
- High: the highest price reached during that period
- Low: the lowest price reached during that period
- Close: the price when that period ended
For example, say a one-hour candle has an open of 100, a high of 108, a low of 96, and a close of 104. With just these four numbers, you can draw the exact shape of the candle's body and wicks.
Body and wicks
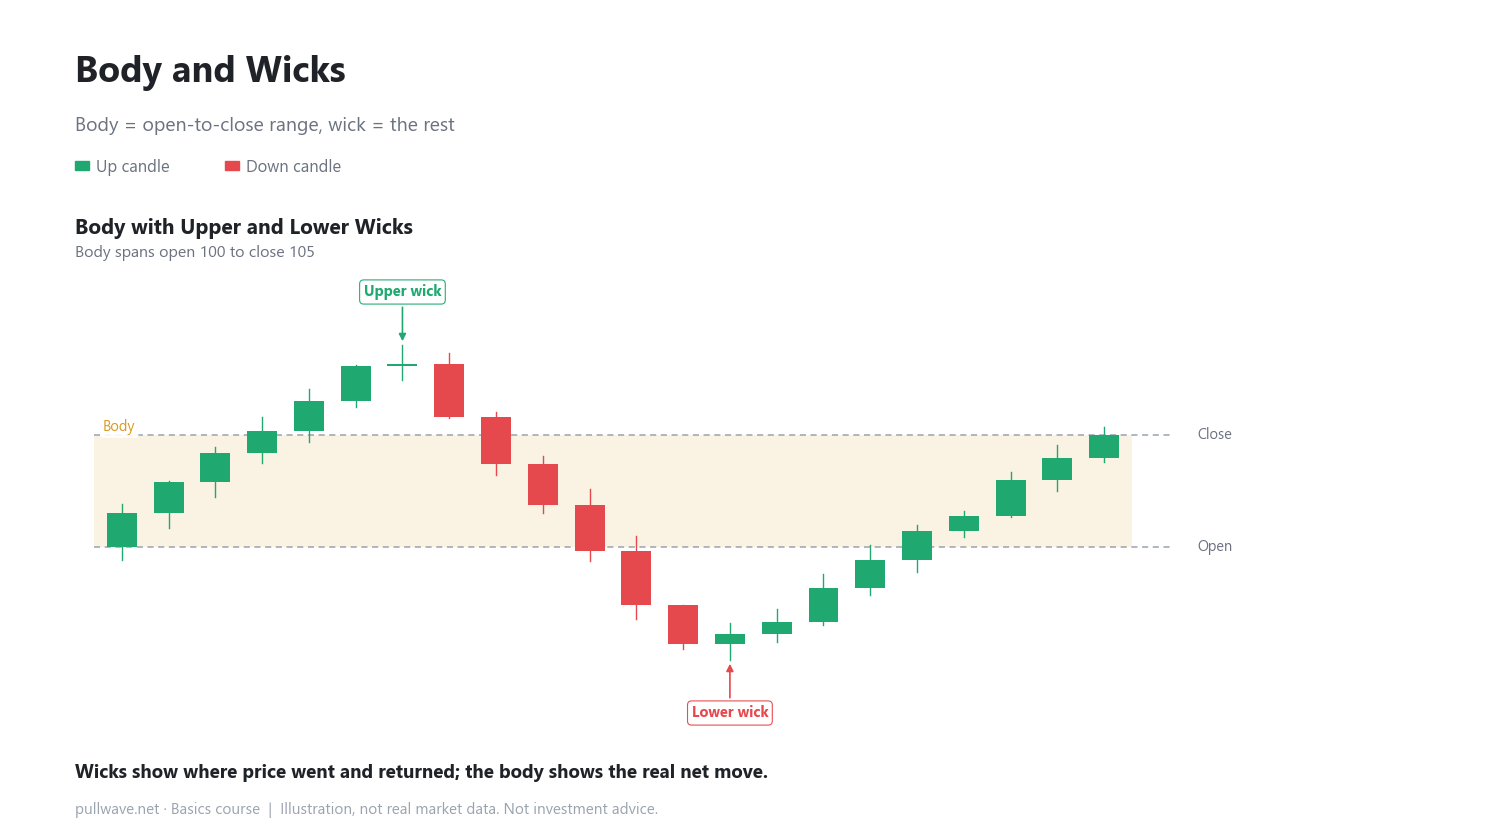
A candle has two parts. The thick rectangle between the open and close is the "body." The thin lines extending above and below the body are the "wicks" (or shadows). The body shows how far price actually moved net during that period, while the wicks show where price went and then came back from.
Bullish and bearish candles
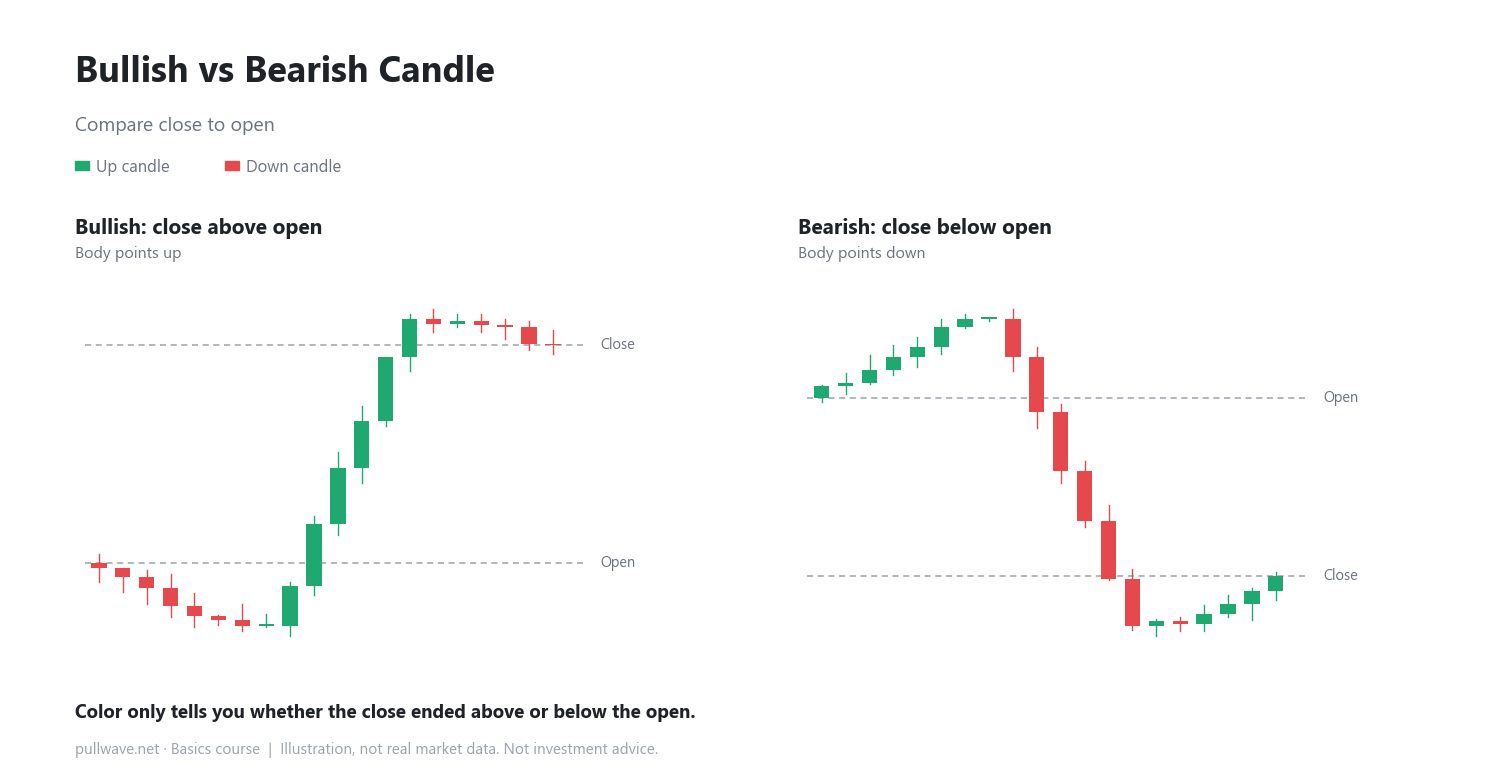
If the close ends up higher than the open, the candle is usually colored green (or white) and called "bullish." If the close ends up lower than the open, it's usually colored red (or black) and called "bearish." The color only tells you whether price ended up or down during that period — it says nothing about the path it took to get there.
Smaller candles combine into one
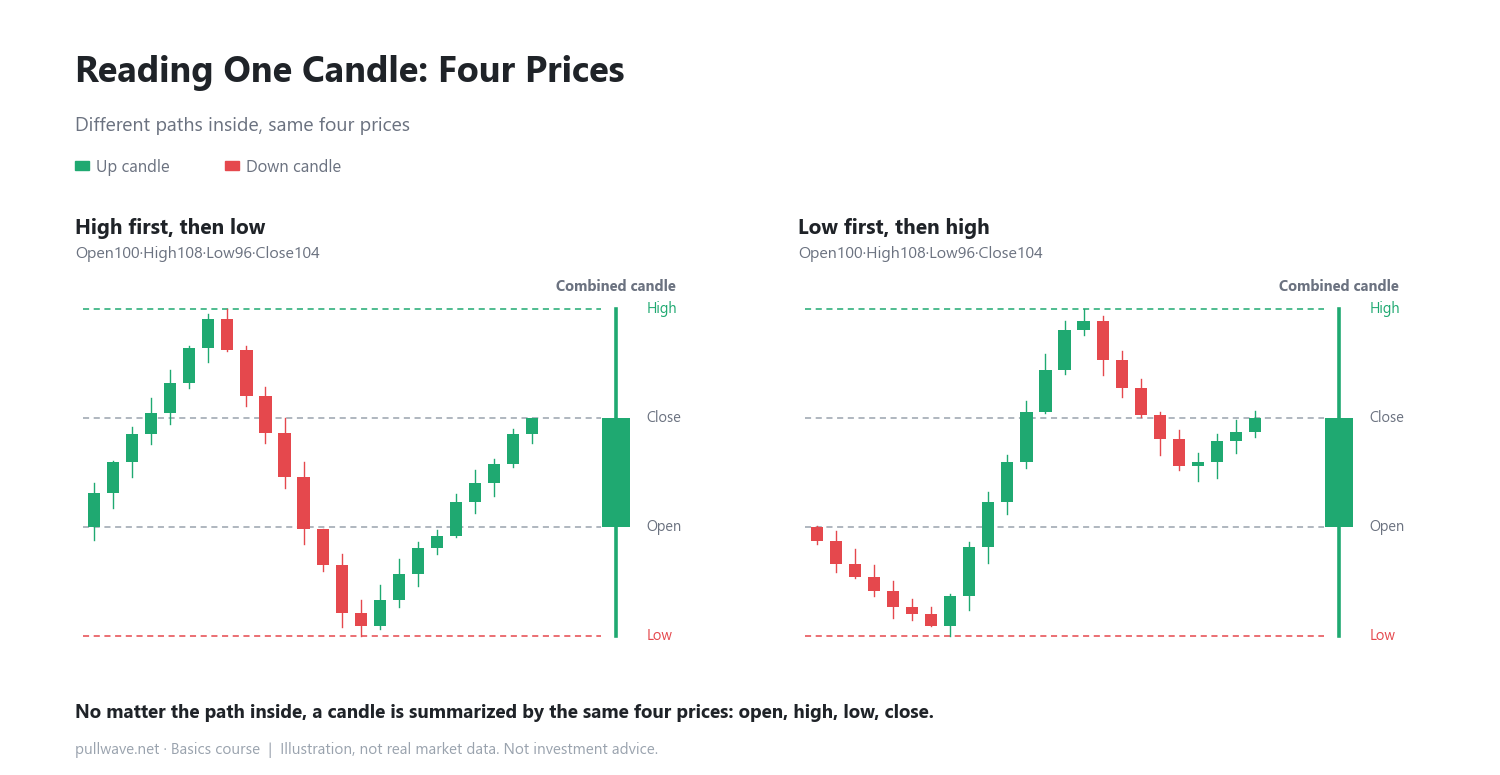
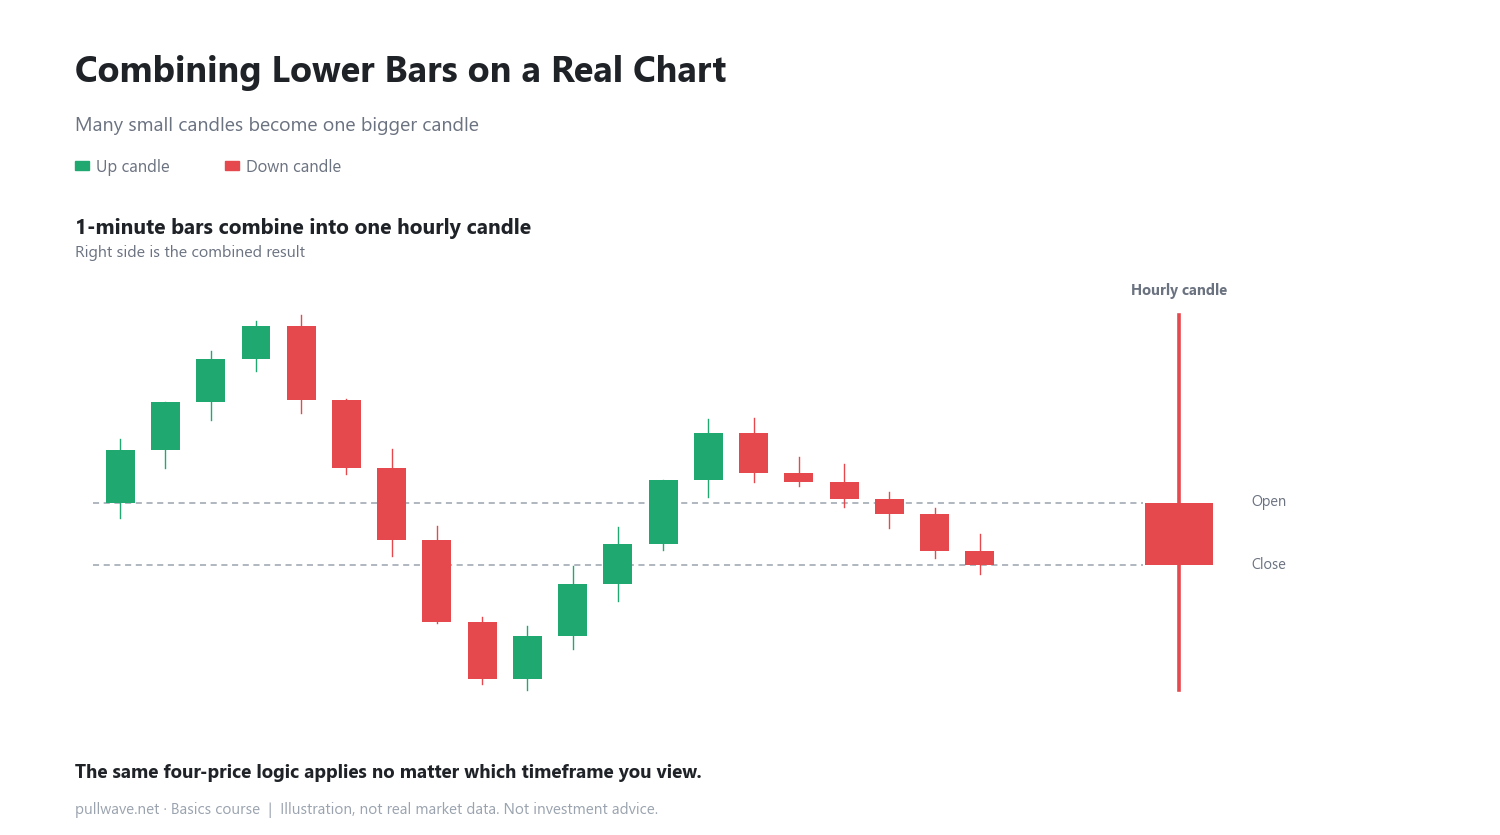
A larger candle is actually built from many smaller-timeframe candles. One hourly candle is the result of sixty 1-minute candles. One daily candle is the result of twenty-four hourly candles. As those smaller candles move up and down, whichever point goes the highest becomes the high, and whichever point goes the lowest becomes the low. The very first price in that sequence becomes the open, and the very last price becomes the close.
How to use it on a real chart
When you open a chart, get in the habit of first checking the open, high, low, and close of the candle you're looking at. A long body means price moved strongly in one direction during that period. A short body with long wicks means price swung both ways but ended up near where it started. Comparing the body and wick lengths across several candles in a row helps you get a feel for how forcefully price was moving in that stretch.
Common misconceptions
- Deciding "this is an uptrend" or "this is a downtrend" just from one candle's color is premature. A single candle's color only describes what happened during that period — it doesn't tell you what the next candle will do.
- A long wick isn't automatically a special signal on its own. It simply shows that price went somewhere and came back; what it means depends on the broader context.
FAQ
Who decides the time period of a candle?
You do, as the chart viewer. You can choose any period you want — 1 minute, 5 minutes, 1 hour, 1 day — and the candles get redrawn to match. The next lesson covers exactly how candles change when you switch timeframes.
Can a bullish candle still appear after a big drop?
Yes. A bullish candle only means the close was higher than the open within that single candle — it says nothing about the overall trend compared to earlier candles. To see the bigger picture, you need to look at multiple candles together.
General education, not investment advice. The picture is an illustration, not real market data.