Basics course · Lesson 28 · Part 4 · Indicator basics
RSI Overbought/Oversold: Common Myths
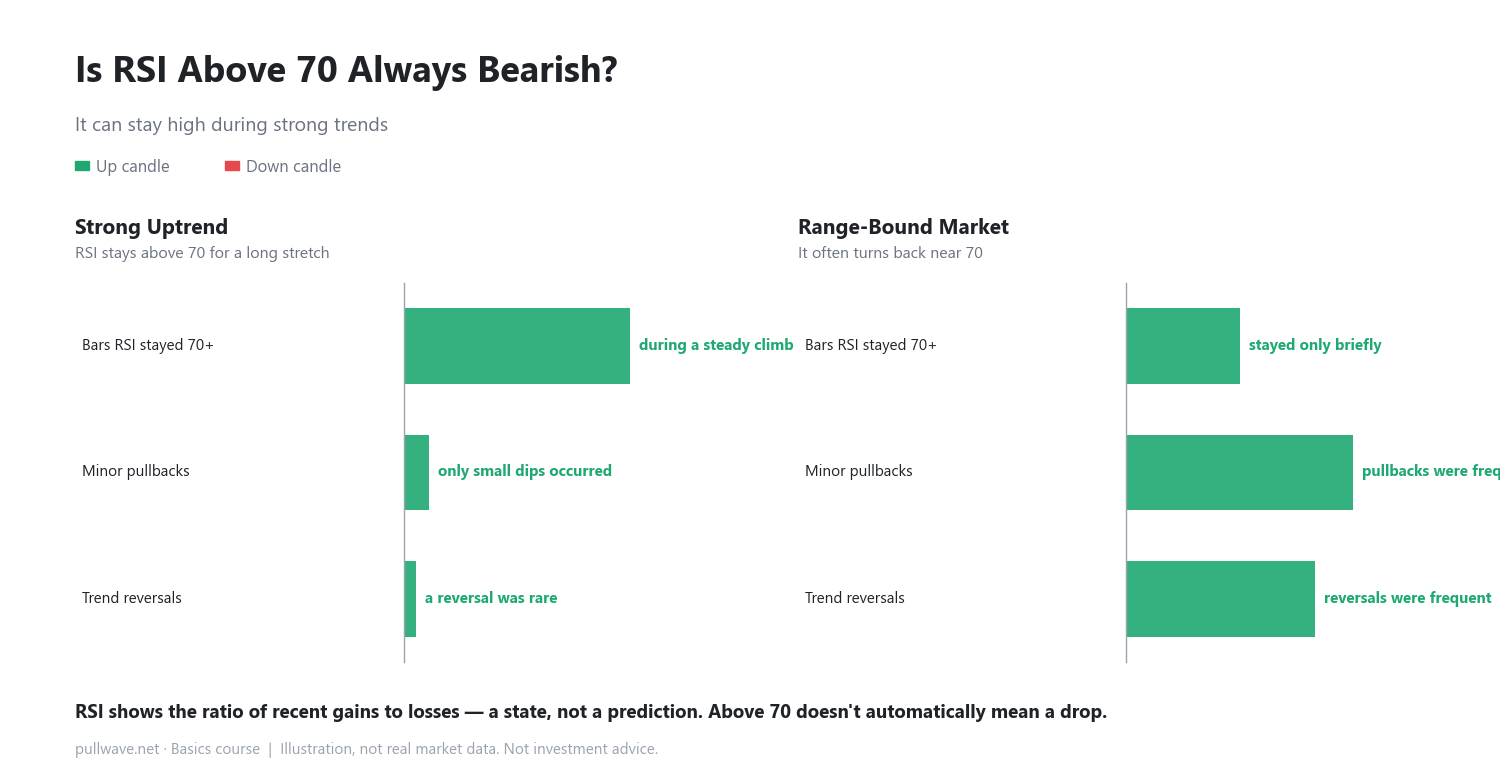
At a glance
- RSI turns the ratio of recent gains to losses into a 0-100 number
- A reading above 70 doesn't guarantee a drop
- Strong trends can keep RSI in the high zone for a long time
In the last lesson, you learned that when price swings get smaller, they eventually get bigger again — the idea of contraction and expansion. Starting with this lesson, we move into the basics of indicators, tools that summarize price action into numbers. The first and most common one is RSI (Relative Strength Index).
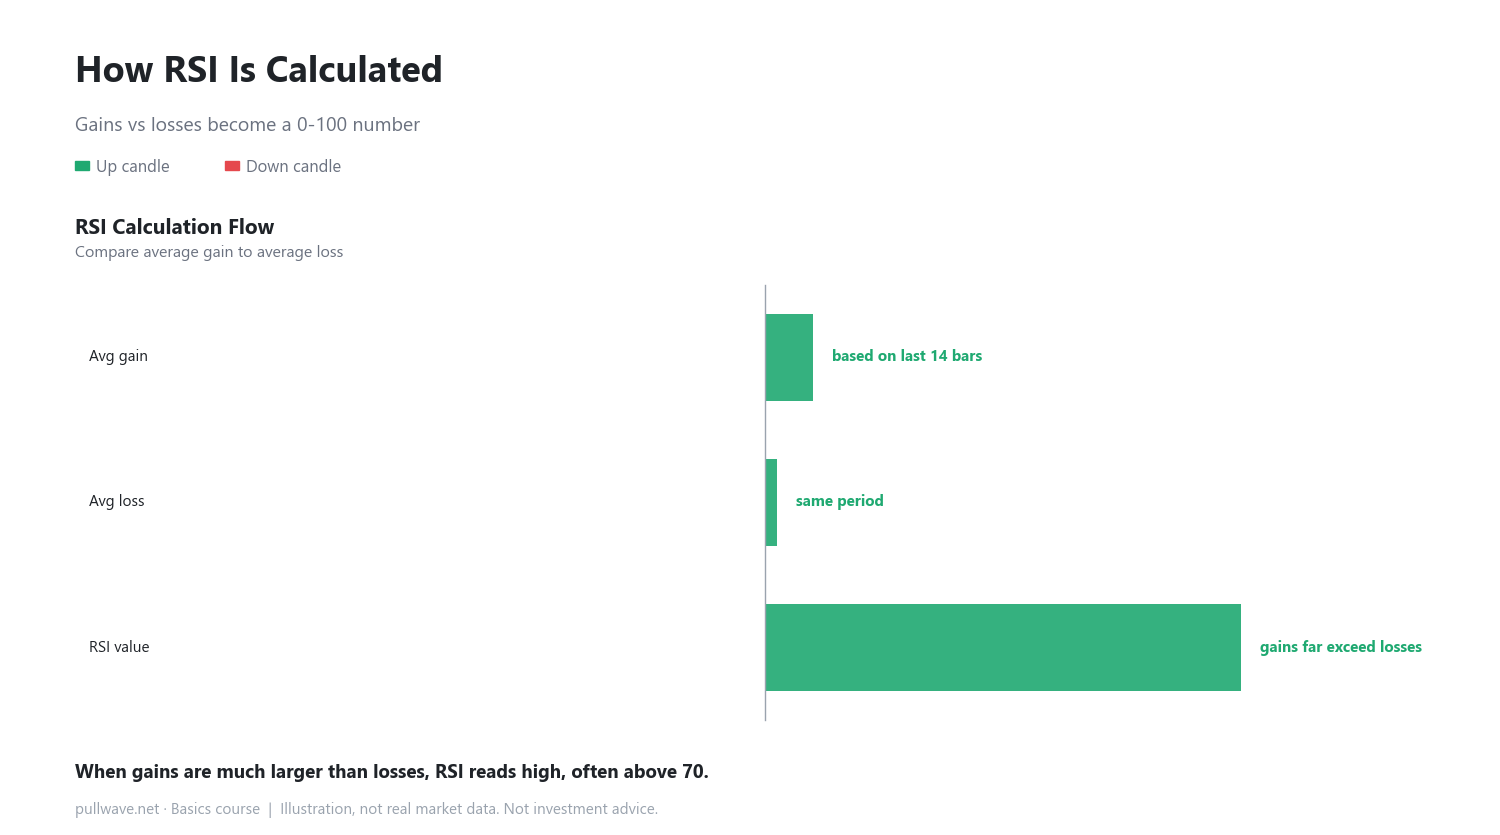
RSI compares how much price has gone up versus how much it has gone down over a recent period, and turns that into a single number between 0 and 100. When gains are much bigger than losses, the number rises (often above 70, called a "high zone"). When losses are bigger, the number falls (often below 30, a "low zone").
What RSI Actually Measures
The calculation: a ratio of gains to losses
RSI looks complicated, but the idea is simple. Over a recent set of bars (commonly 14), you find the average gain and the average loss, turn that into a ratio, and convert it into a 0-100 number. For example, if the average gain is 8 and the average loss is 2, the ratio is 4, and running that through the formula gives an RSI near 80.
Above 70 does not automatically mean a drop
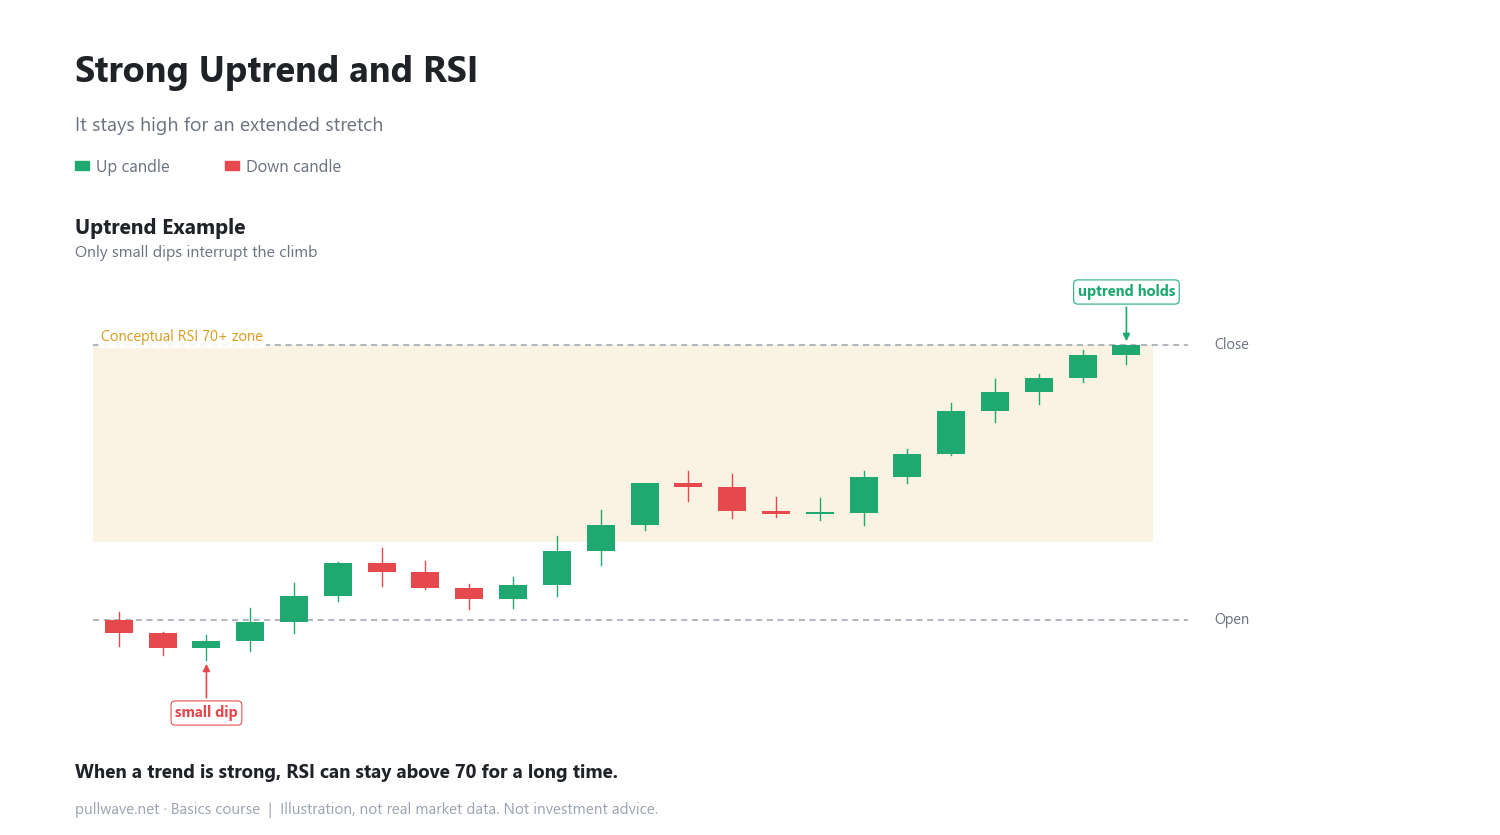
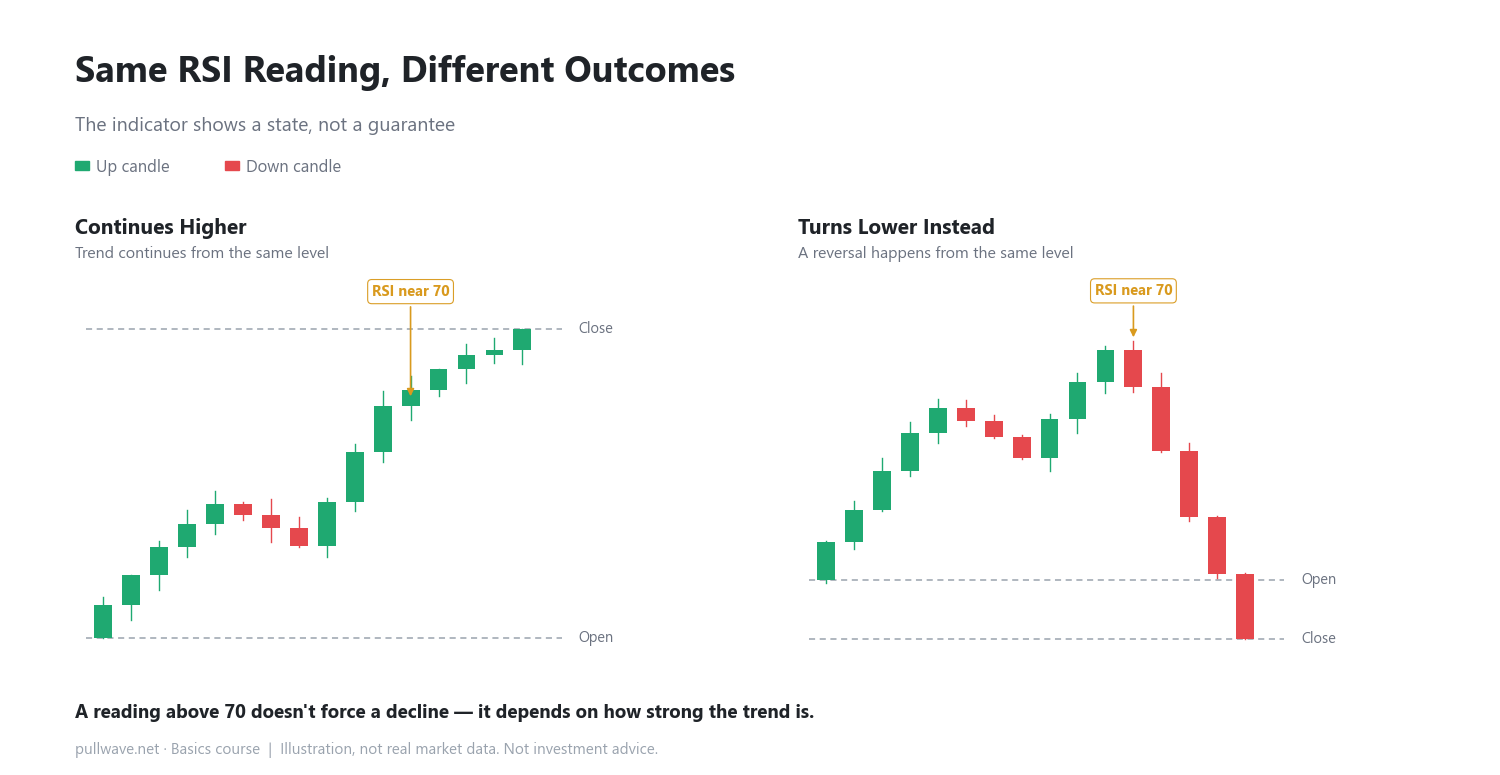
Many beginners assume "RSI above 70 means price will fall soon." But RSI only reflects the ratio of gains to losses up to that point — it does not predict what comes next. In a strong uptrend, gains keep outweighing losses for a long stretch, so RSI can stay above 70 for quite a while.
Range-bound markets behave differently
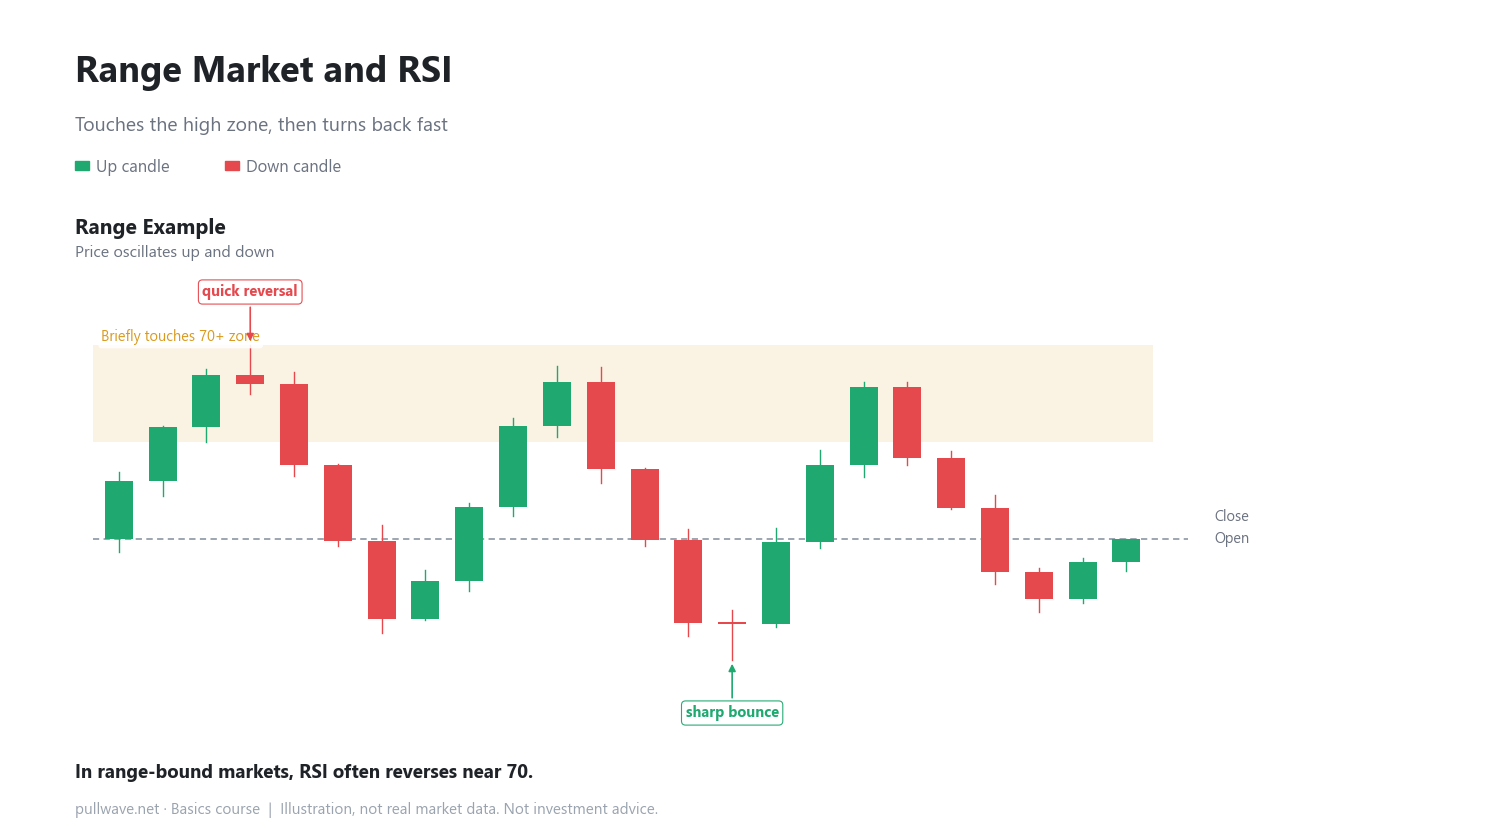
In a market moving sideways without a clear direction, gains and losses alternate more often, so RSI tends to touch 70 and turn back down quickly. The same number — "above 70" — can play out very differently depending on the type of market.
Same reading, different outcomes
This is why it helps to think of RSI not as a fortune teller predicting what happens next, but as a state display showing the current balance of buying and selling pressure.
How to use it on a real chart
When you look at RSI on a chart, don't judge it by the number alone — first check what kind of price action it's part of. If price is in a strong trend, RSI staying in the high zone can simply mean the trend is still active. If price is range-bound, the swing between the high and low zones itself becomes useful context. Either way, it's best to combine RSI with price structure or other tools rather than relying on it alone.
Common misconceptions
- Assuming a drop is coming the moment RSI crosses above 70 — in reality, strong trends can keep it there for a long time.
- Assuming a rise is coming the moment RSI falls below 30 — a strong downtrend can keep it there just as long.
FAQ
Can I change the RSI period from 14 to something else?
Yes. A shorter period (like 7) makes RSI more sensitive and jumpy. A longer period (like 20) makes it smoother. There's no single "correct" period — it depends on your own analysis style.
Do I have to treat 70 and 30 as fixed rules?
No. 70 and 30 are commonly used reference levels, not strict rules. In strongly trending markets, some traders use different reference points, like 80 and 20. What matters more than the exact number is understanding what state it represents.
General education, not investment advice. The picture is an illustration, not real market data.