Basics course · Lesson 11 · Part 2 · Reading candles
How a Lower Wick Forms: Panic Sell vs. Slow Recovery
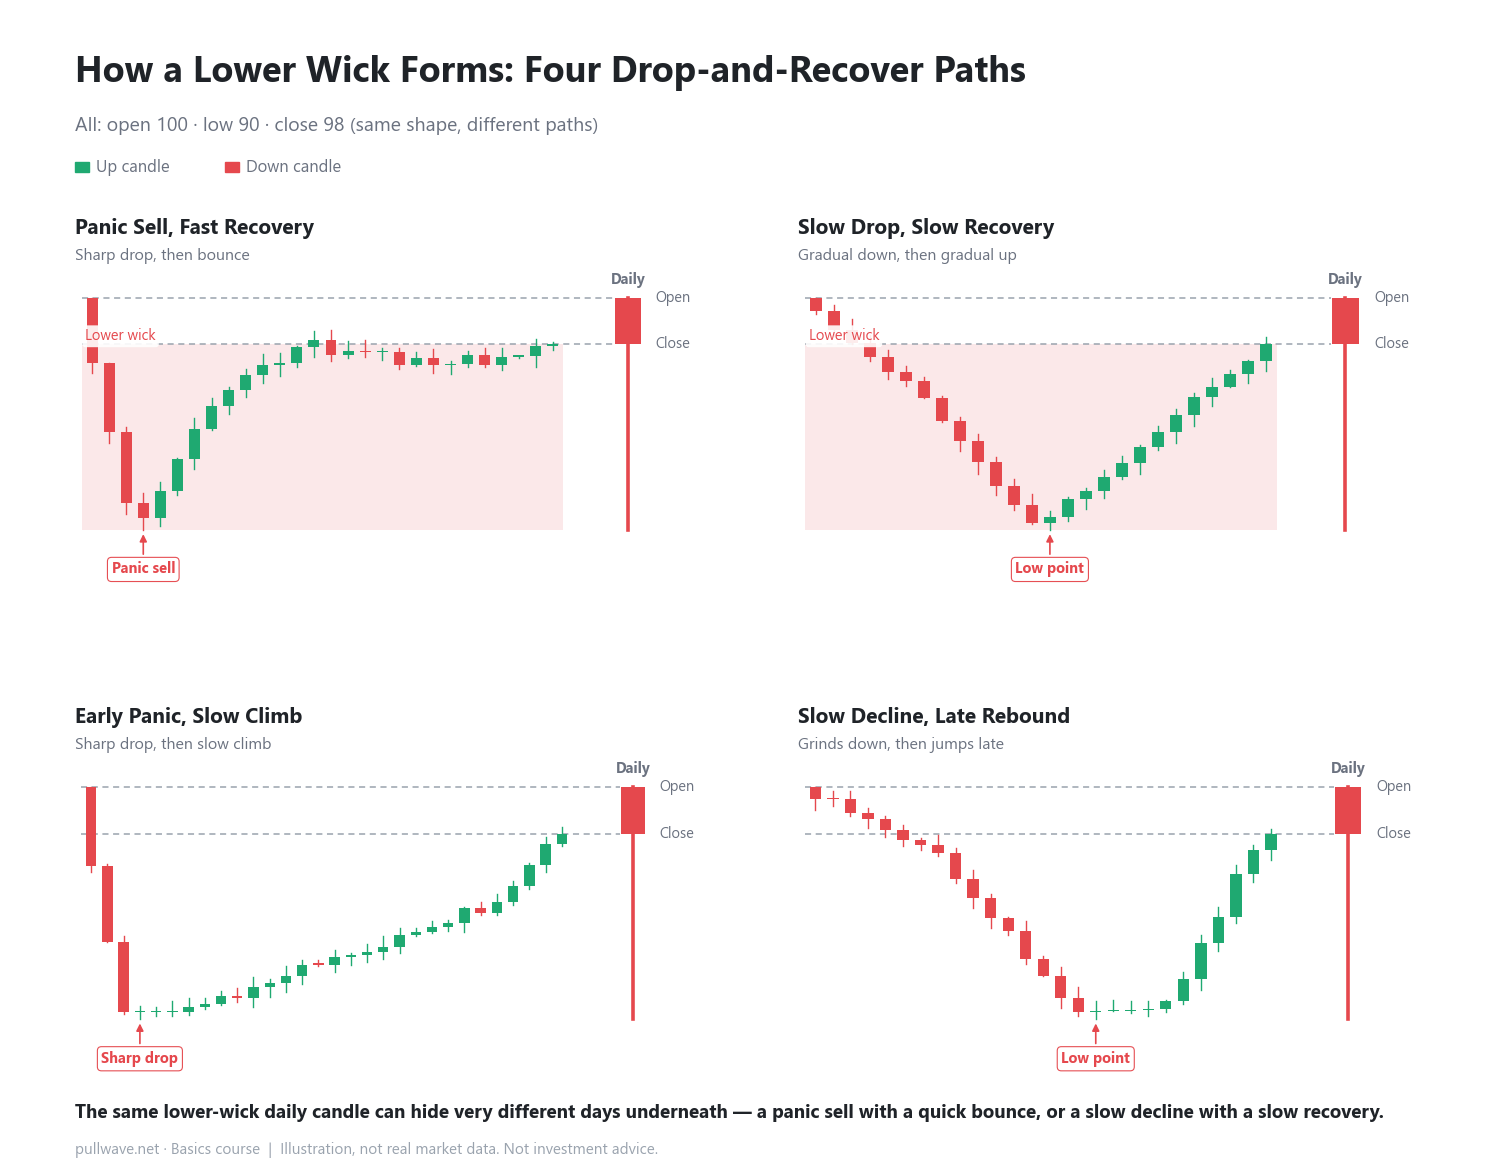
At a glance
- A lower wick is where price fell to a low and then climbed back up before the close.
- One path is a fast panic sell followed by a quick bounce; another is a slow decline and slow recovery.
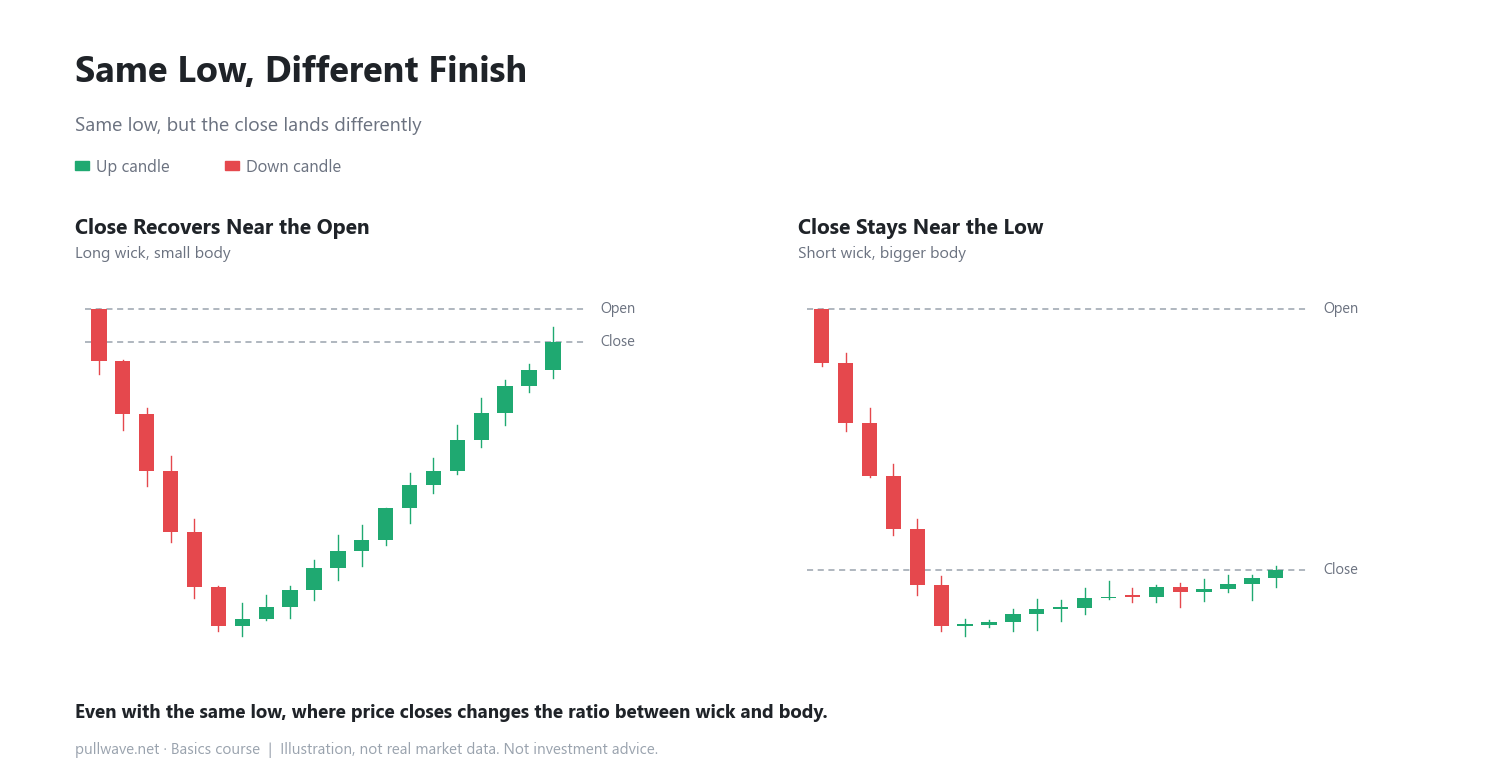
- Even with the same low, where the close ends up changes the wick-to-body ratio.
In the last lesson we looked at how an upper wick forms — price pushed up, then came back down before the candle closed. This lesson covers the opposite shape: the lower wick.
A lower wick (or lower shadow) is the part of a candle where price dropped down to the low, then climbed back up before the close. The farther the low sits below the body (the lower of the open and close), the longer the lower wick looks.
Numbers make this easier to see. Say the open is 100, price dips to a low of 90 during the period, and the candle closes at 98. The body sits between open 100 and close 98 (a difference of 2, so it's small), while the stretch from the low of 90 up to the close of 98 (a difference of 8) becomes the lower wick. The wick ends up much longer than the body.
Two ways a lower wick can form
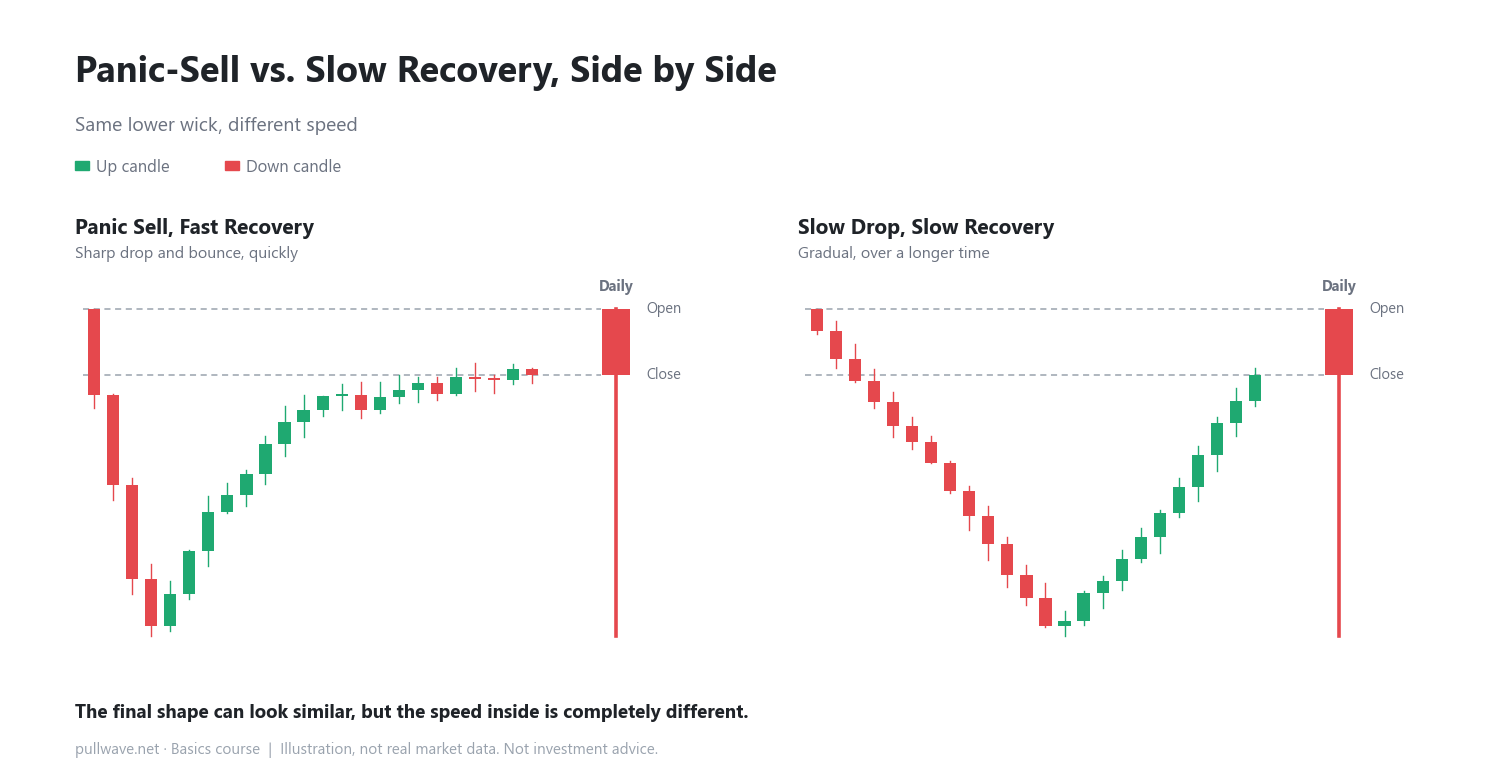
Two daily candles can look identical — same long lower wick — yet hide completely different days when you zoom into a shorter timeframe, like the 15-minute chart.
Panic sell, then quick recovery
Price drops sharply in a short window as sellers rush out at once, pushing the price deep down quickly. Then buyers step in at the lower price and the market bounces back relatively fast. Both the decline and the recovery happen over a short stretch of time.
Slow decline, then slow recovery
Here, both the drop and the recovery are gradual. Instead of one burst of selling and one burst of buying, price edges down little by little, then edges back up little by little. The final daily candle can look similar to the panic-sell type, but the pace and rhythm inside are completely different.
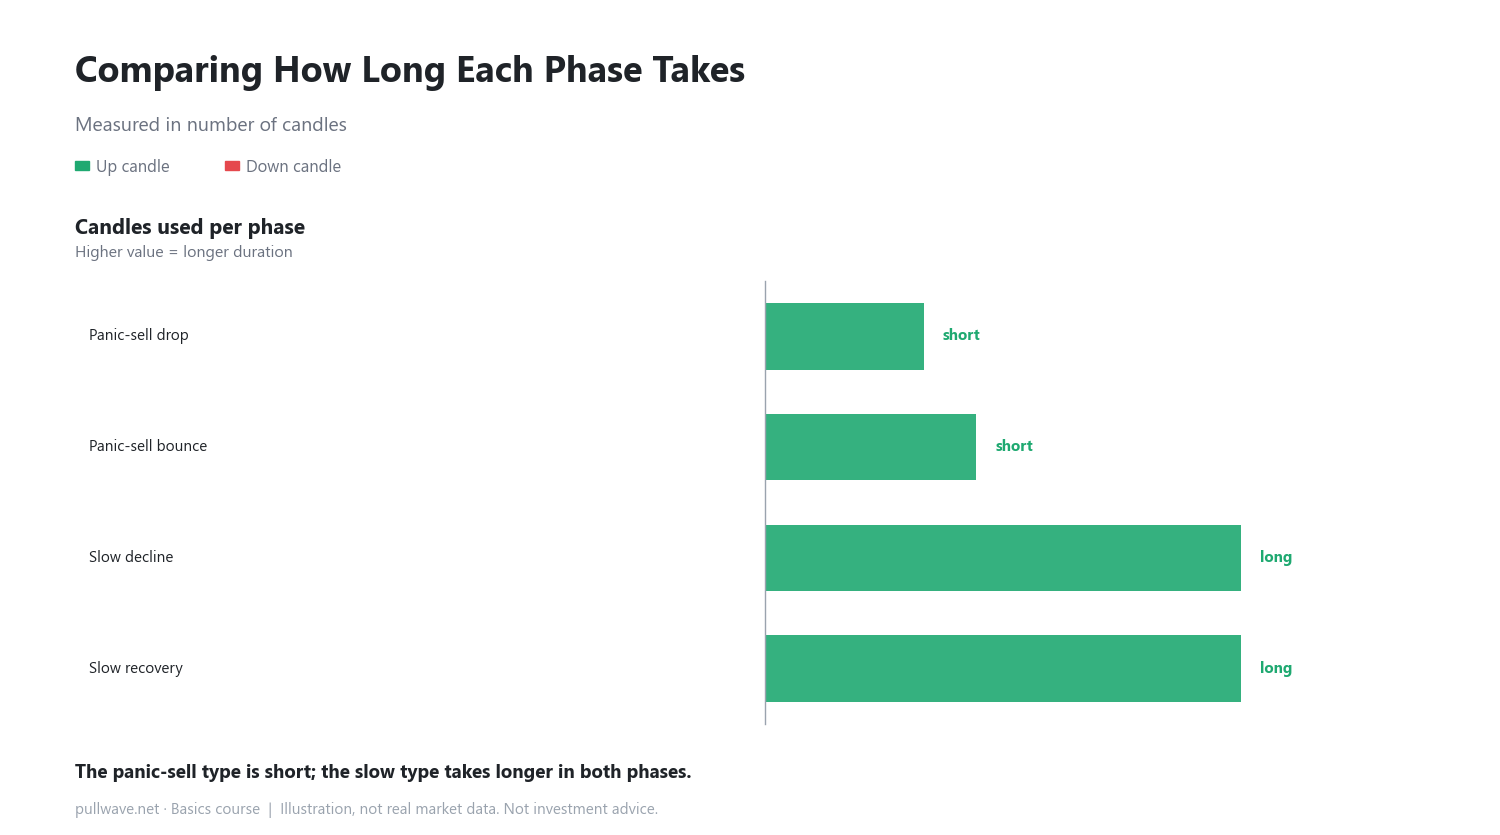
Comparing how long each phase takes
Counting the number of candles used for the decline and the recovery makes the contrast clearer. The panic-sell type uses very few candles for both the drop and the bounce, while the slow type stretches both phases over many more candles.
Same low, different finish
Even when the low is the same — say 90 both times — where the candle finally closes changes the ratio between wick and body. If the close recovers all the way back near the open, the wick looks long and the body stays small. If the close stays closer to the low, the wick looks short and the body (to the downside) looks larger.
How to use it on a real chart
On a real chart, start by spotting a candle with a long lower wick on a longer timeframe, such as the daily or 4-hour chart. Then drop down to a shorter timeframe, like the 15-minute or 5-minute chart, and check for yourself whether that stretch was a quick panic-and-bounce or a slow decline-and-recovery. The goal is simply to see, with your own eyes, that the same wick shape can hide very different underlying movement.
Common misconceptions
- Some traders assume a long lower wick always signals an upcoming bounce. In reality, a wick is just a record of what happened during that period — it's not a promise about what comes next.
- It's also a misconception to label one type (panic-sell or slow-recovery) as the "better" shape. They simply differ in speed and rhythm; neither one can be generalized as leading to a better outcome.
FAQ
What should I watch for if a candle has both a long upper and lower wick?
A single candle can have long wicks on both ends at once. When that happens, the body shrinks, and it simply means price was pushed both ways during that period. The next lesson covers the doji (cross-shaped candle), which is this kind of back-and-forth taken to its extreme.
If I zoom into a shorter timeframe, will it always clearly match one of the two types?
Not always. In practice, the two types often blend together — for example, a sharp early drop followed by a slow, gradual recovery. Treat panic-sell and slow-recovery as two ends of a spectrum; real price action often lands somewhere in between.
General education, not investment advice. The picture is an illustration, not real market data.