Basics course · Lesson 12 · Part 2 · Reading candles
What Really Happens Inside a Doji Candle
At a glance
- A doji forms when the open and close are nearly equal, leaving a very thin body.
- The same doji shape can hide a quiet day or a hard-fought tug-of-war, depending on its range.
- Don't read a single doji in isolation — check wick length and the trend before it.
In the last lesson, we looked at how a long lower wick forms — a sign that price dropped and then climbed back. This lesson covers a special candle shape: the doji, where the open and close are nearly the same price.
A doji shows up often on candlestick charts. Its body (the thick part between open and close) is very thin or almost a flat line, while the wicks above and below can be long. That's why traders call a doji a "candle of hesitation." When the opening price and the closing price end up almost equal, it means buyers and sellers fought over that period, but neither side came out clearly ahead.
Core idea
What a doji actually is
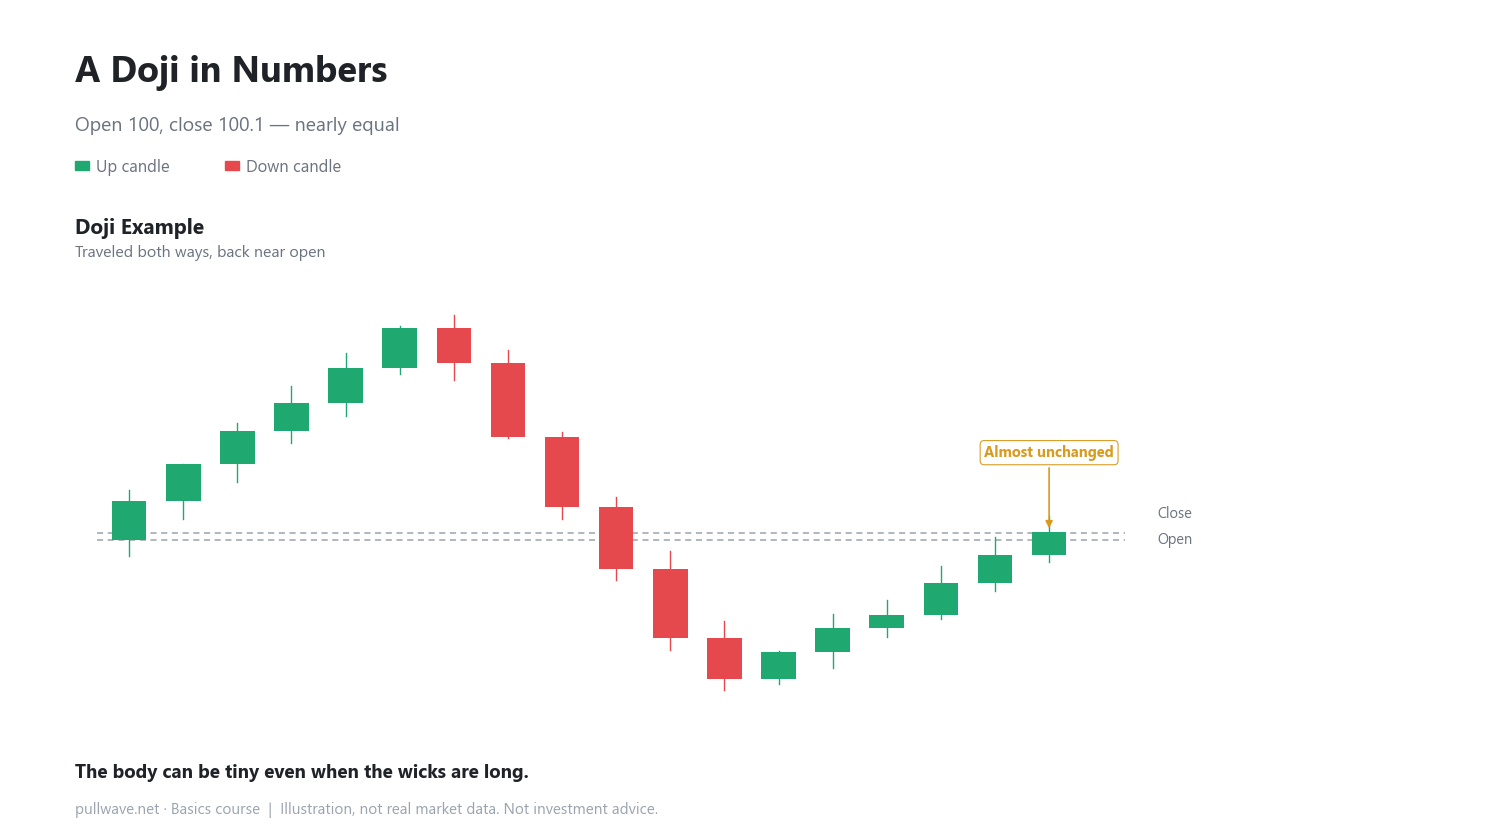
A doji forms when the open (the price at the start of the period) and the close (the price at the end) are nearly identical. For example, if the open is 100 and the close is 100.1, the body is almost invisible. A thin body doesn't mean price didn't move — it may have traveled far up or down and simply returned to where it started.
Same doji, very different days
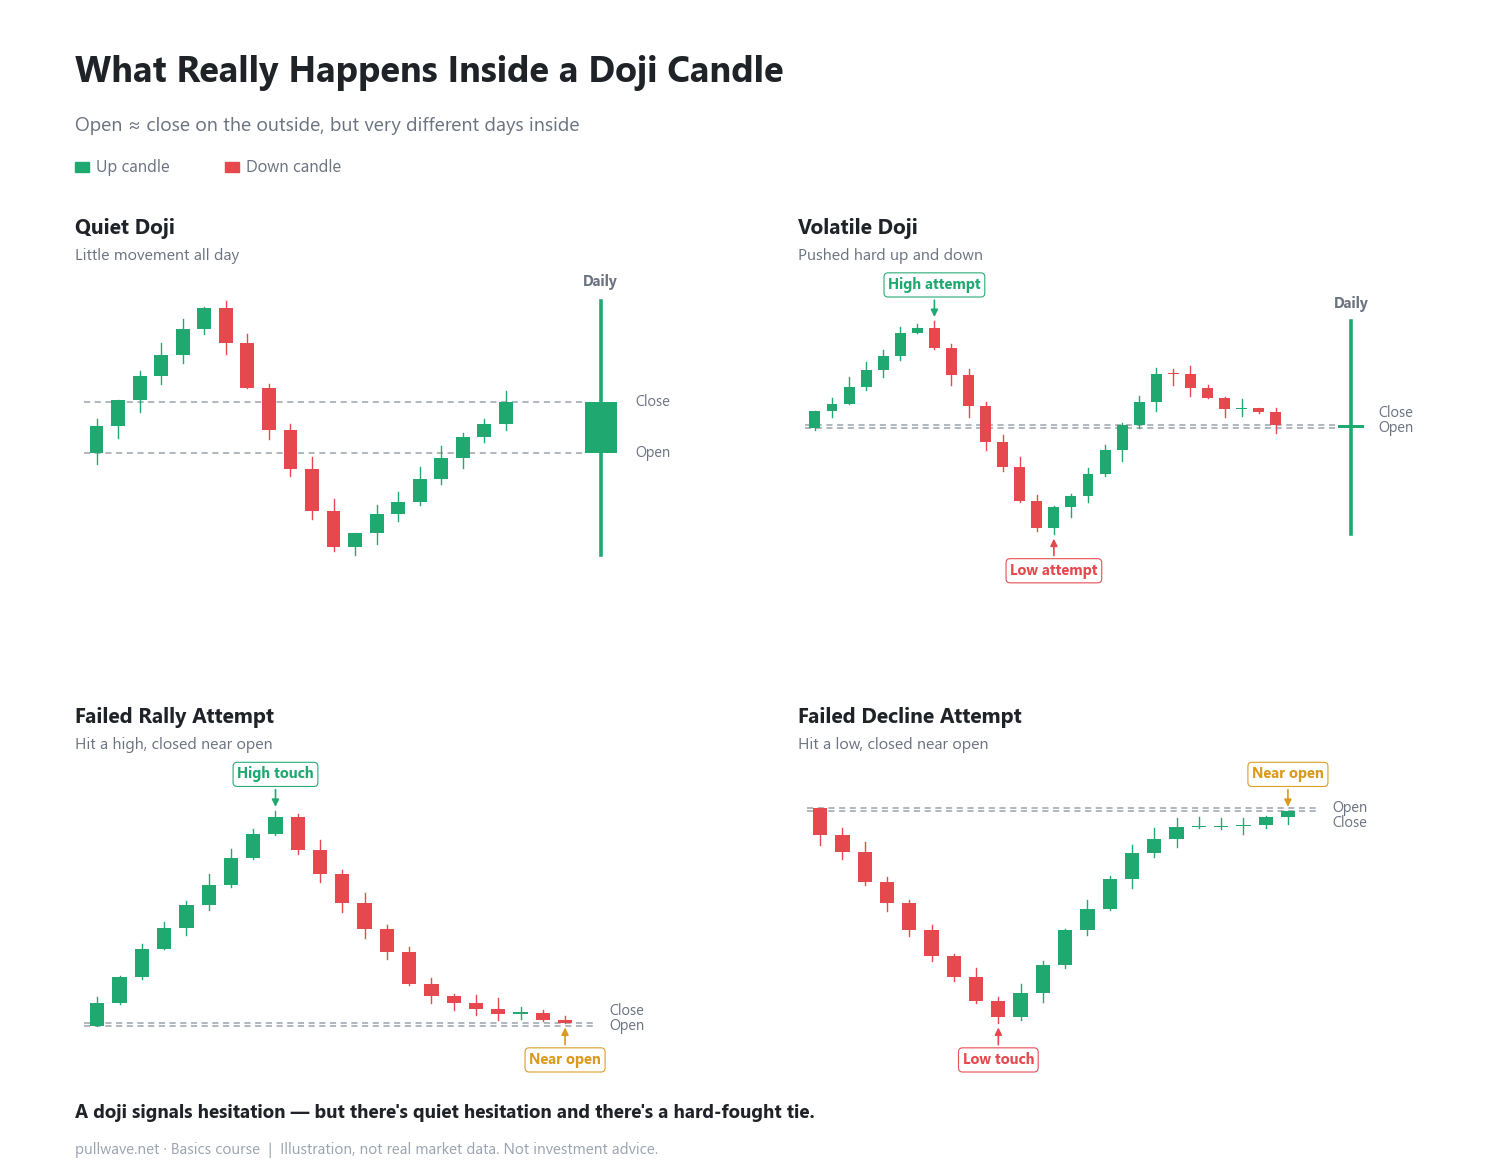
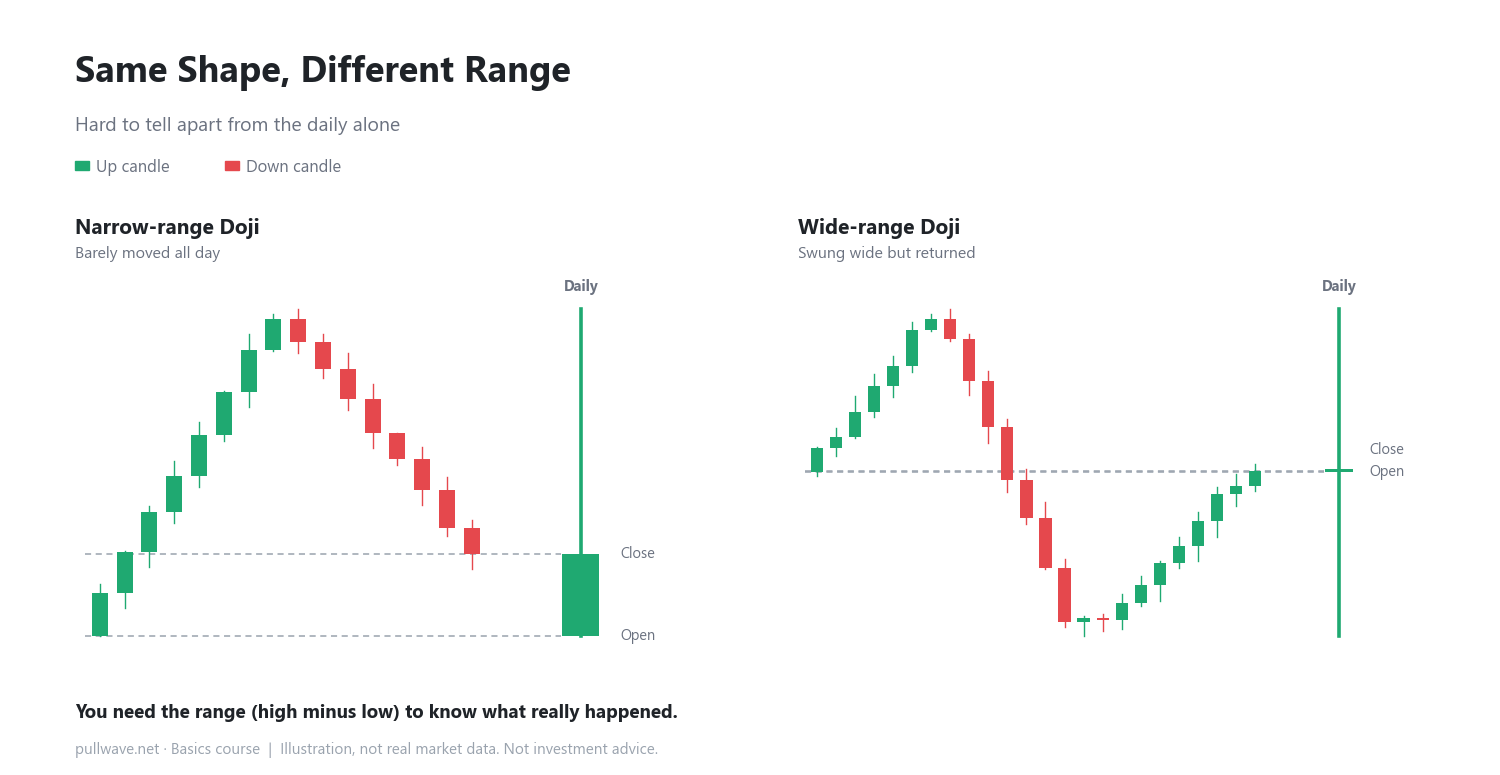
Here's the key point. Two dojis can look identical on the chart — open ≈ close in both — yet what happened inside them can be completely different. One day price barely moved at all; it was quiet from start to finish. Another day price surged up sharply, then dropped sharply, and finally settled back near the open. Both end up as the same thin cross shape on the daily chart, but the size of the fight inside is not the same. A wide-range doji (a big gap between the high and the low) tells you buyers and sellers both pushed hard and neither won — a more notable event than a quiet, narrow-range doji.
A day that pushed up and gave it back
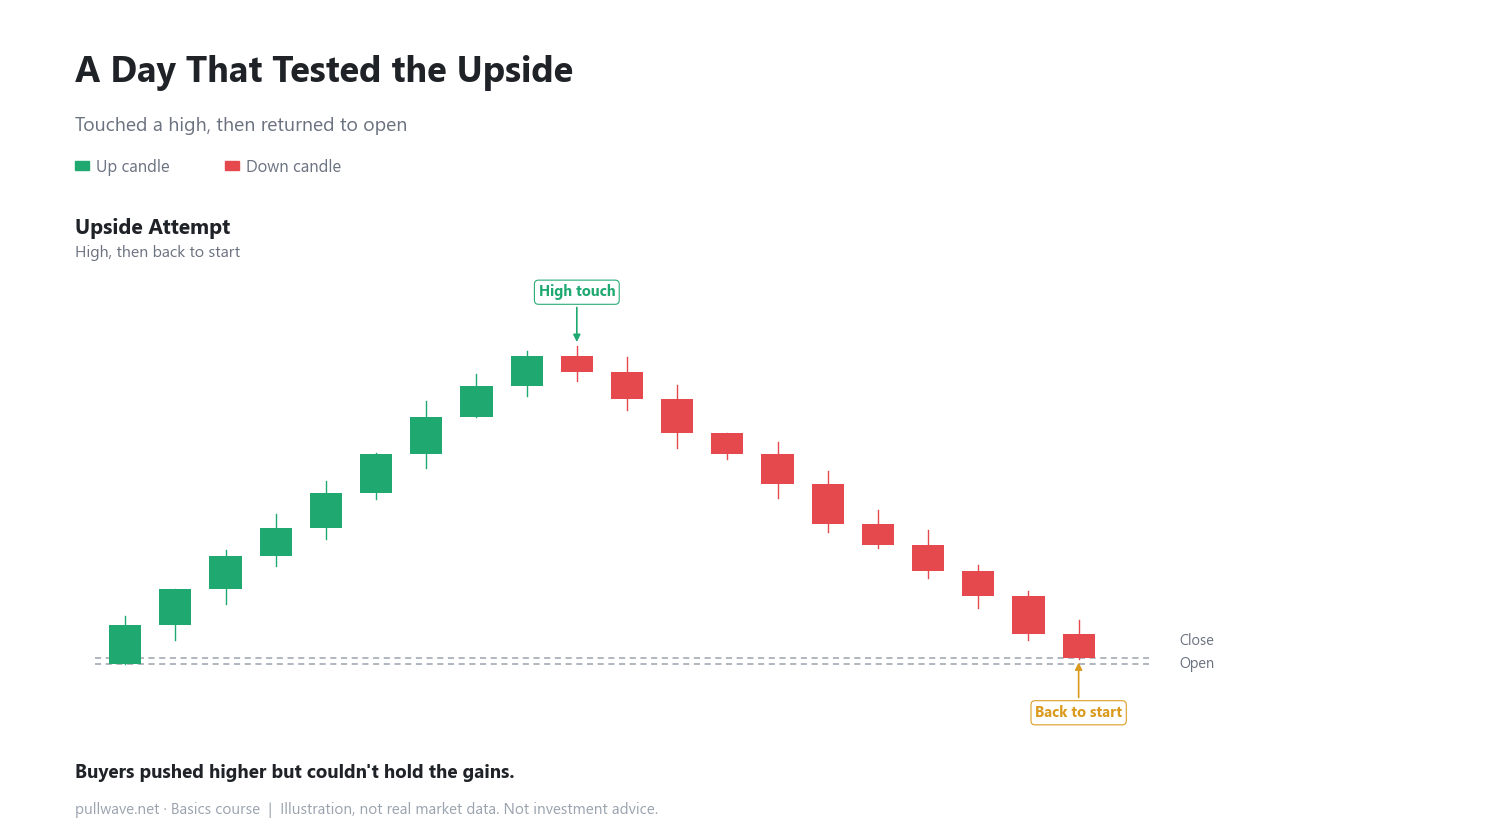
Some dojis form when price rallies well above the open during the period, but buyers can't sustain it, and price drifts back down to close near the open. This pattern tells a story of "an attempt to go higher that didn't hold."
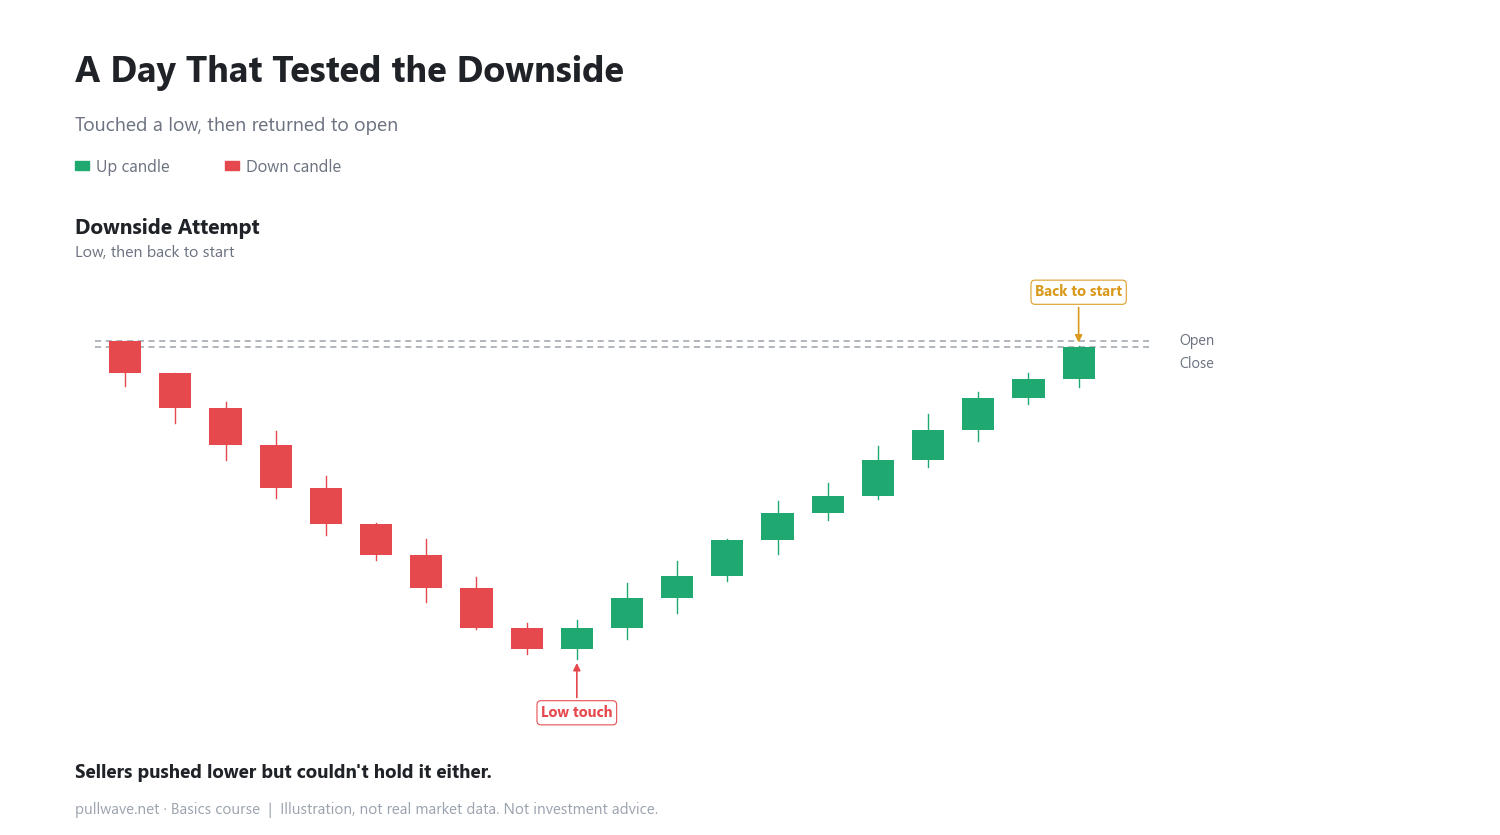
A day that pushed down and recovered
The mirror image also happens: price drops well below the open, sellers can't keep pushing, and price recovers back toward the open by the close. Direction is flipped, but the story is the same — effort was made, but it didn't carry through.
How to use it on a real chart
When you spot a doji on a real chart, get in the habit of checking not just the thinness of the body but also the wick length — the gap between the high and the low. A doji with long wicks and a wide range tells you buyers and sellers clashed hard at that level. A doji with short wicks and a narrow range might just be a quiet stretch with little trading activity. It also helps to look at what happened before the doji — whether price had been climbing, falling, or moving sideways — rather than reading the single candle in isolation.
Common misconceptions
- It's easy to assume a doji means the trend is about to reverse. In reality, a doji only shows that buyers and sellers were evenly matched during that period; it doesn't tell you what comes next.
- It's also easy to assume all dojis mean the same thing. As we saw, a wide-range doji and a narrow-range doji can tell very different stories.
FAQ
Does a doji mean price will reverse right away?
No. A doji simply shows that buying and selling pressure were roughly balanced during that period. What happens next depends on the candles that follow and the broader context.
Does the open and close have to be exactly equal to count as a doji?
Not exactly. In real markets, the open and close are rarely perfectly identical, so traders usually treat a very small difference as a doji. What matters most is that the body looks extremely thin compared to the full range (high minus low) of that period.
General education, not investment advice. The picture is an illustration, not real market data.