Basics course · Lesson 10 · Part 2 · Reading candles
How an Upper Wick Actually Forms
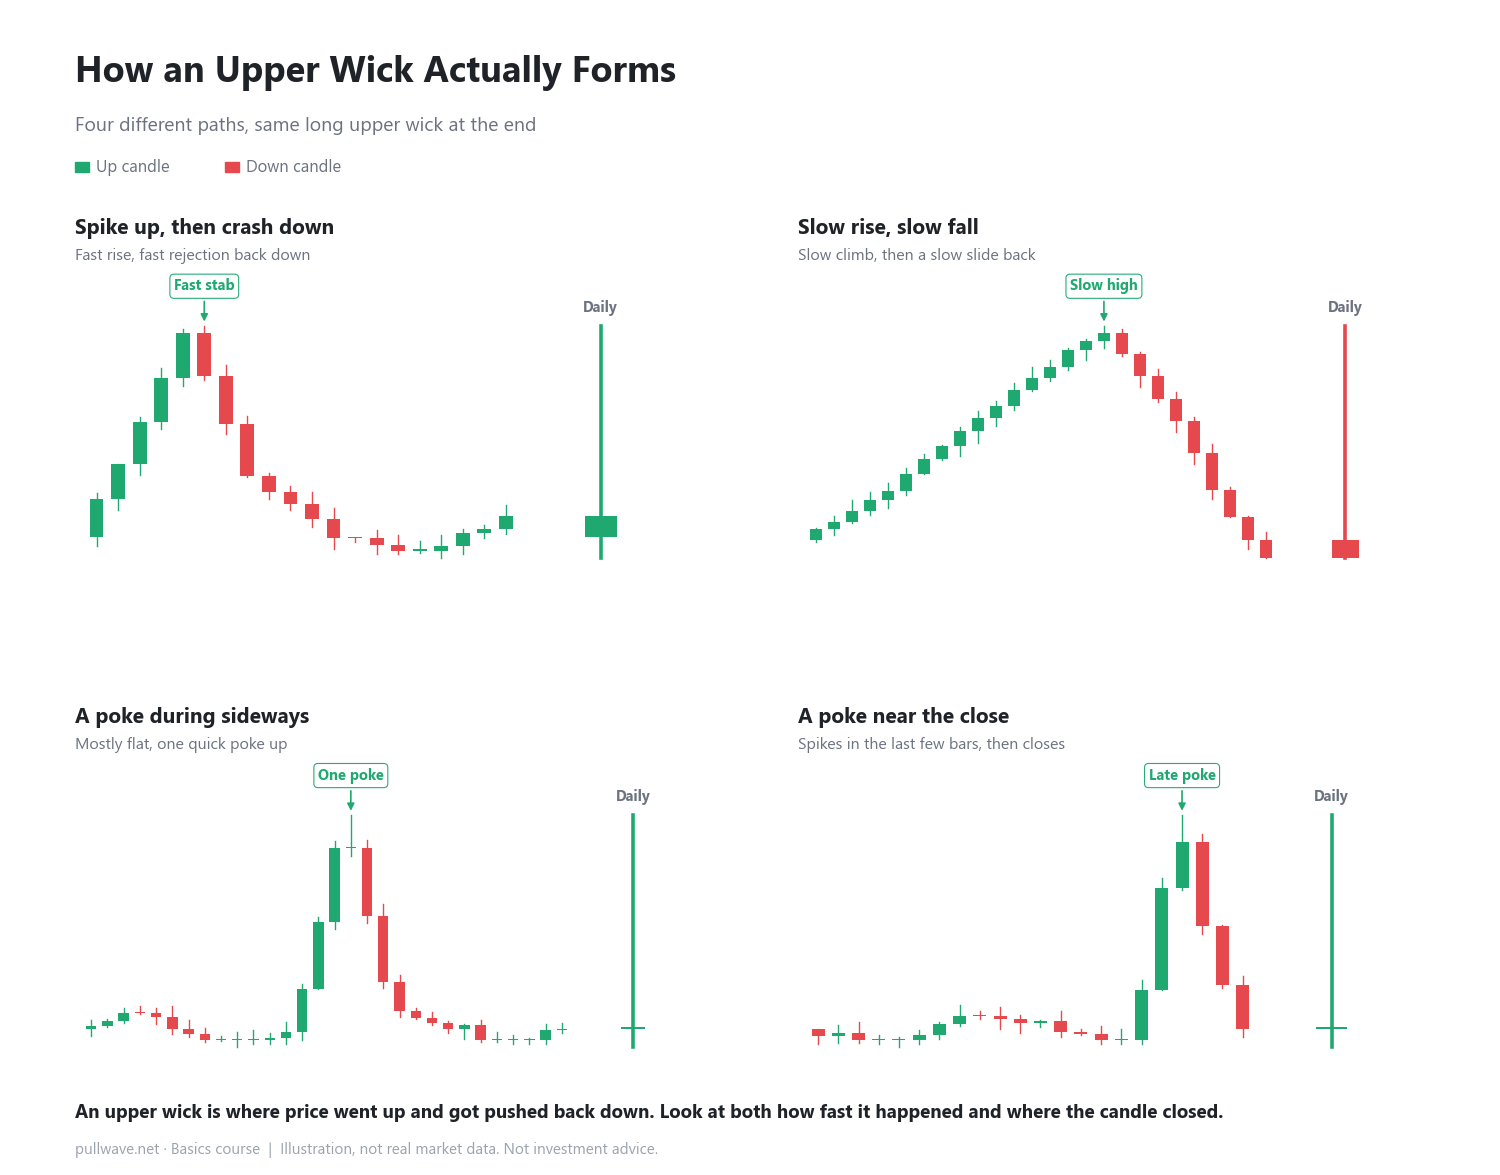
At a glance
- Upper wick length = high minus the higher of open or close
- A fast stab and a slow rise-and-fall can produce the same wick but different stories
- Where the close lands matters as much as how long the wick is
In the last lesson you saw that a single daily candle can hide many different paths once you look at a shorter timeframe like the 15-minute chart. Today we zoom in on one common shape: the upper wick, and look closely at how it actually forms.
What an upper wick really is
Every candle is built from four numbers: the open (the first price), the close (the last price), the high (the highest price reached), and the low (the lowest price reached). The upper wick is simply the high minus whichever is higher, the open or the close. It's the visual record of "price went up, then got pushed back down." Two candles can have the exact same upper wick length yet have walked completely different paths to get there.
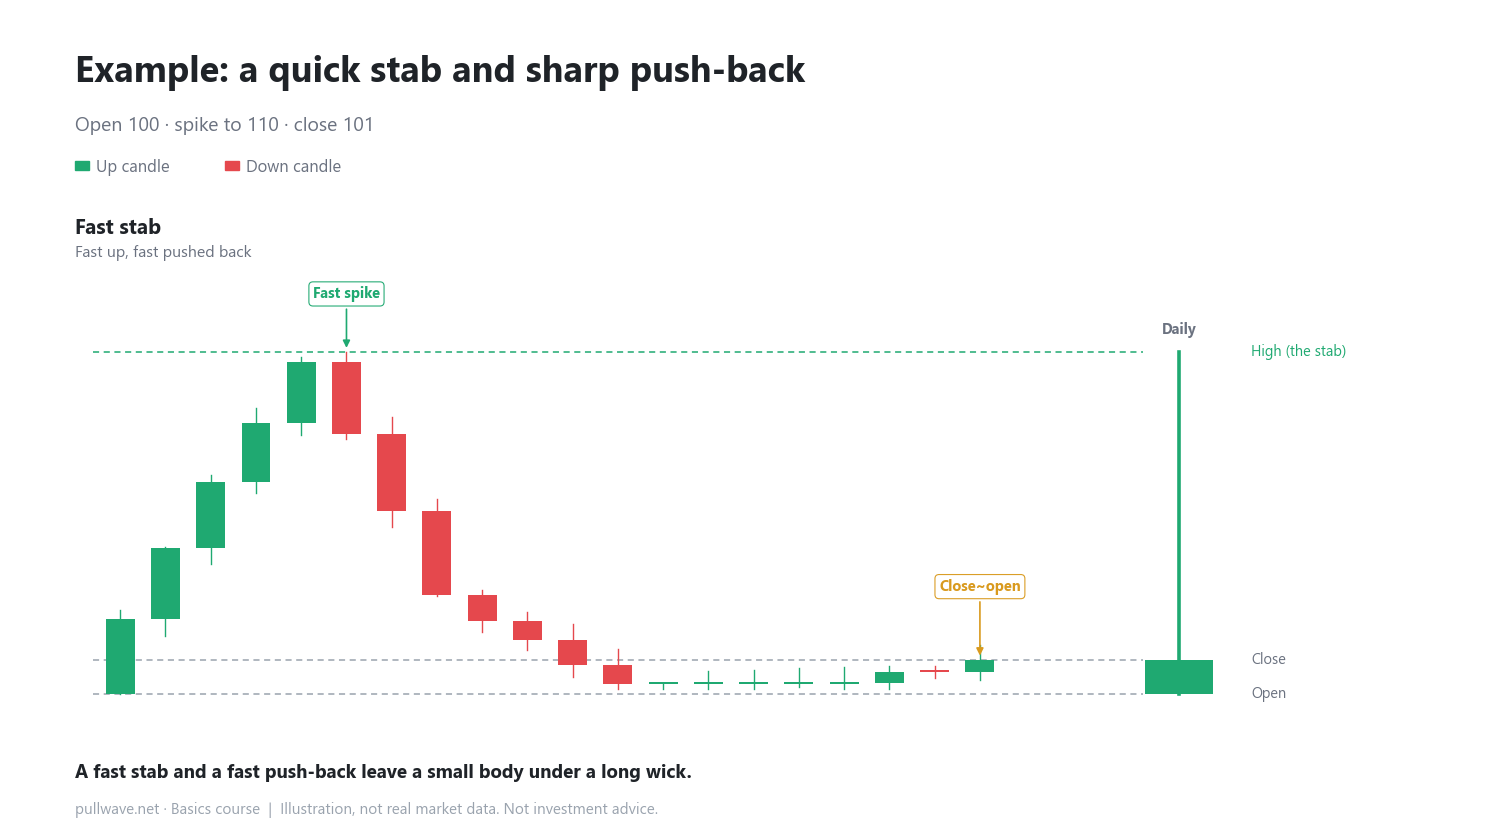
A fast stab and a fast push-back
Say the open is 100. In just a few quick moves, price jumps up to 110, and then in a few more quick moves it gets pushed back down to close at 101. The upper wick length is 110 minus 101, which equals 9. This kind of shape often reads as buying pressure piling up in a very short window, followed by selling pressure arriving just as fast. Price "stabbed" upward and snapped right back.
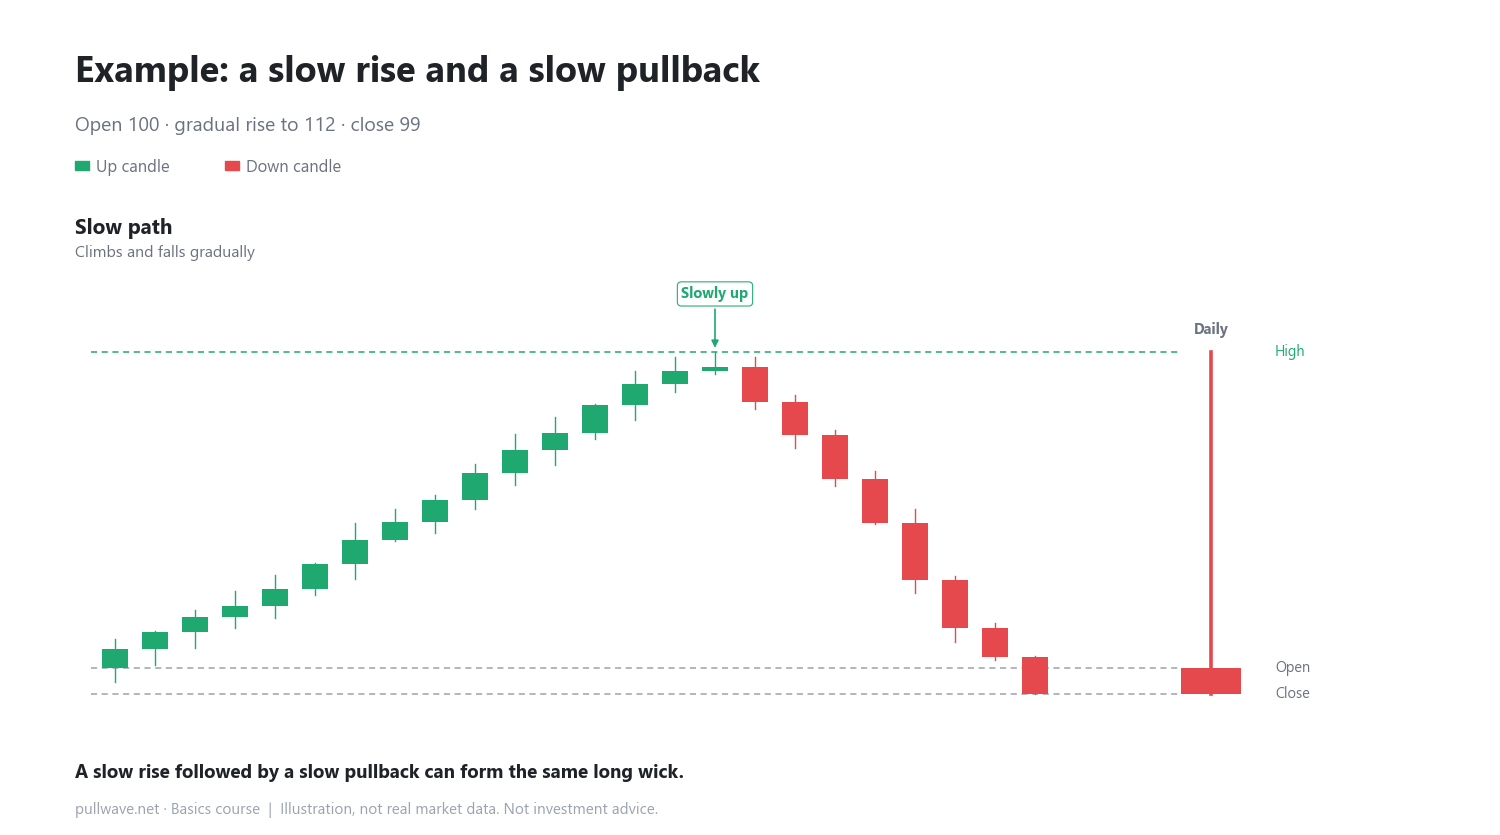
A slow rise and a slow pullback
Now picture the opposite: price opens at 100, climbs gradually over many smaller steps up to 112, then drifts back down over many more steps to close at 99. This also produces a long upper wick, and if you only look at the high and the close, it can look similar to the fast-stab case. But the difference is that both the climb and the pullback took time. This kind of path looks less like one side suddenly overwhelming the other, and more like buying and selling pressure slowly trading places over the session.
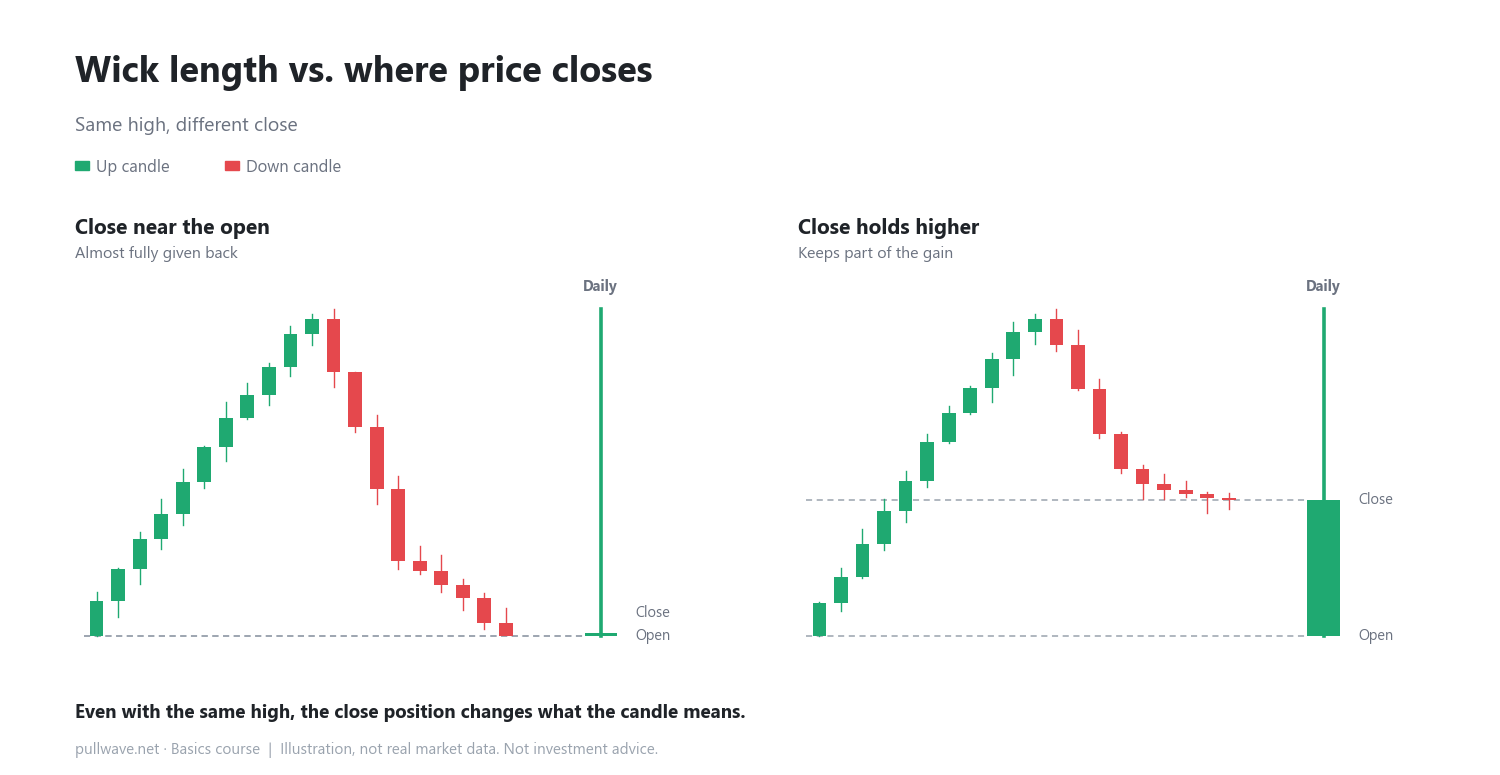
What the closing position tells you
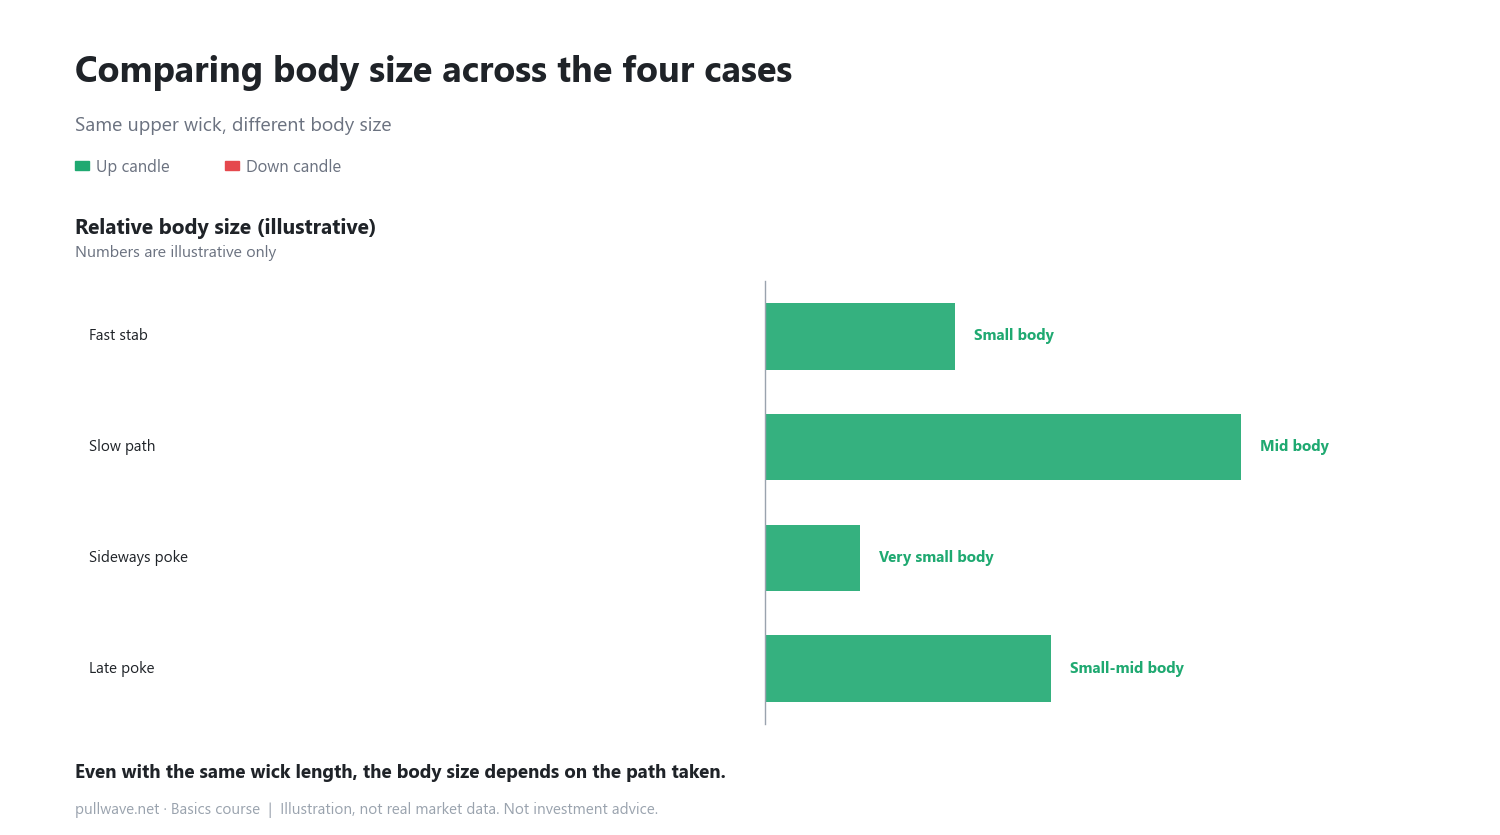
Just as important as the wick's length is where the close actually landed. If the close sits near the open, meaning the candle gave back almost everything it gained, the body ends up very small. If instead the close holds a bit closer to the high, the wick is still long, but some of that day's gain was kept. The same high can carry a different meaning depending on where the candle actually closed.
How to use it on a real chart
When you spot a long upper wick on a daily candle, you can drop down to a shorter timeframe, an hourly or 15-minute chart, and check for yourself whether price stabbed up quickly, climbed and fell slowly, poked once during a sideways stretch, or only spiked in the last few bars before the close. As you learned in the previous lesson, one higher-timeframe candle is simply built from many lower-timeframe candles stacked together, so looking inside it can reveal that two candles with the same wick are actually telling different stories.
Common misconceptions
- Some traders assume a long upper wick always points to one specific future direction. A single wick can't tell you what happens next on its own, you also need to consider the context, such as whether the candle appeared during a trend or inside a sideways range.
- Others assume a long wick always means price moved fast. As shown above, a slow climb followed by a slow pullback can produce an upper wick that is just as long.
FAQ
Does a longer upper wick always mean a bigger signal?
Wick length only tells you how far price traveled and came back. You also need to look at the context the candle appeared in, trending or sideways, and where the close ended up, to get a clearer picture.
Should I read upper wicks and lower wicks the same way?
The basic logic is the same. A lower wick shows the place where price fell and then came back up. In the next lesson, we'll look closely at exactly how a lower wick forms.
General education, not investment advice. The picture is an illustration, not real market data.